June 19, 2023, 12:06 am EDT
Parabolic UpSwing Pattern (SPY)
It is always essential to keep calm and cautious after the excitement. When the conditions became overheated, it may turn to the other direction quickly.
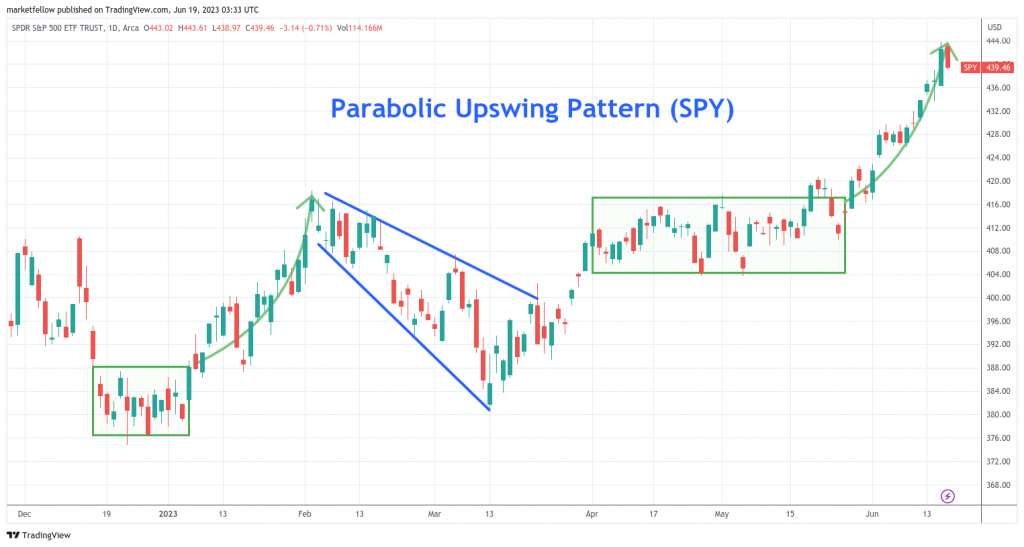
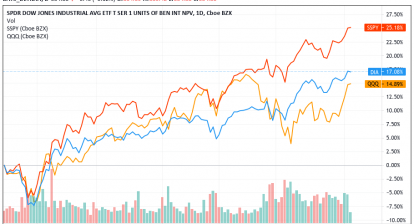
Please look at S&P 500 ETF (SPY) as an example. After making a fresh 13-month high and +15% Year-To-Date gains in SPY, its pattern is worth of attention. The upswing started in May 2023 and became so intense that constituted a parabolic pattern.
It means that many people rushed into the markets in hoping to catch the train for a fast ride. Of course, AI expectations (NVDA, MSFT, META, GOOGL), mild inflation (AMZN), pause on rate hikes, and economic recovery made this rally into overheated conditions.
However, check out what happened earlier this year when a similar pattern appeared on the left-hand side of the chart. We can see a sharp decline followed up after the peak in early February. The downtrend in the next 1-2 months returned most of the gains consequently.
Therefore, avoiding getting into the market after the parabolic pattern could reduce the possibility of getting into the trap of the following drop.

