February 13, 2024, 2:17 pm EST
Major Crack and Potential Supports
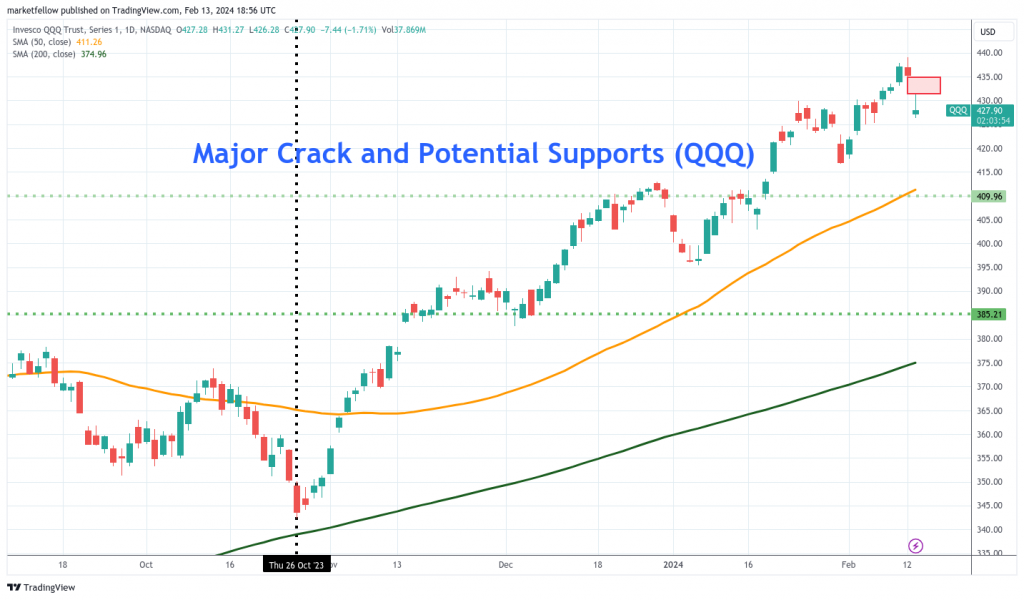
It is one of the strong rallies in the stock markets in the past 3-4 months. Nasdaq-100 (QQQ) scored +28% gains (342 to 439) and Dow Jones and S&P 500 also performed very well with numerous record highs.
However, the uptrend is wild and lacks support (volume). Fundamentally, it also does not have strong reasons behind wars, inflations, and China’s slowdown. Overall, this rally is set to be a short-lived event. The problem is that there is no way to predict when the top will be visible.
Today, the stock markets fell sharply after CPI rose to 0.3% in January and 3.1% on an annual basis. The numbers are not horrible but we believe it could be a triggering event to terminate the rally.
Technically, we can see the overbought conditions as QQQ stays far above its trend lines (50 days and 200 days). It describes the high-risk situation for market participants during the pullback process. Today the gap-down breakdown could serve as a warning of the major crack of the uptrend.
The potential support lines are:
- 411 – 50 day-moving-average
- 375 – 200 day-moving-average
- 410 – The horizontal line marked the previous highs
- 385 – The horizontal line marked the previous gap-up and support
We believe 385 is a stronger support. But, it is possible all support lines will not work which will test the low at 345 in the next few weeks or 1-2 months.
Due to the various weak backgrounds mentioned before, we think that it is highly possible the chain reaction of breakdown could come but we cannot guarantee. It is simply our speculations. Everyone needs to make up his / her mind in the stock markets.

