Charts
Chart pattern, indicators, drawing, etc
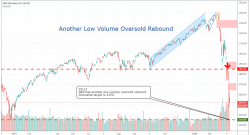
Another Low Volume Oversold Rebound
03/13 S&P has another low volume oversold rebound. Downside target is 2350.
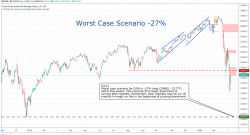
Worst Case Scenario -27%
03/11 Worst case scenario for DJIA is -27% drop (29600 – 21777) within few weeks. This could be first major downtrend of coming bear markets. Remember, bear markets may be 12-18 months in length...
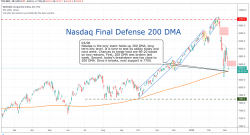
Nasdaq Final Defense at 200 DMA
03/06 Nasdaq is the only index holds up 200 DMA, long term key level. It is time to test its ability today and next week. Chances to break-hold are 80-20 based on two reasons. First, 200 DMA was broke...
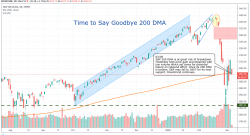
Time to Say Goodbye 200 DMA
03/05 S&P500 200 DMA is at great risk of breakdown. Yesterday high price gain accompanied with low volume which set tones for potential failure on rebound effort. Once its 200 DMA is broken, S&...
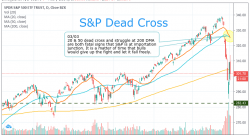
S&P Dead Cross
03/03 20 & 50 dead cross and struggle at 200 DMA are both fatal signs that S&P is at importation junction. It is a matter of time that bulls would give up the fight and let it fall freely.
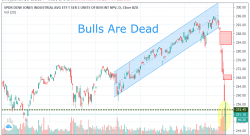
Bulls Are Dead
02/28 Multiple heavy volume sell-offs, reversal, gap-down, breakdown occurred within 1-2 weeks that smashed Dow Jones index and all major indexes with more than -13% off from record high. It is very s...
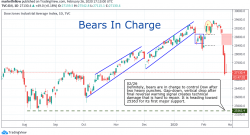
Bears In Charge
02/26 Definitely, bears are in charge to control Dow after two heavy punches. Gap-down, vertical drop after final reversal warning signal creates technical damage that is hard to repair. It is heading...
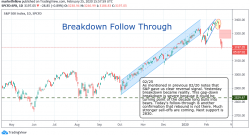
S&P500 Breakdown Follow Through
02/25 As mentioned in previous 02/20 notes that S&P gave us clear reversal signal. Yesterday breakdown became reality. This gap-down breakdown is severe because it could be turning point of the de...
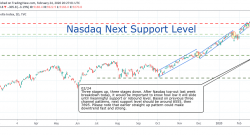
Nasdaq Next Support Level
02/24 Three stages up, three stages down. After Nasdaq top-out last week breakdown today, it would be important to know how low it will slide until meaningful support or rebound level. Based on previo...