Charts
Chart pattern, indicators, drawing, etc
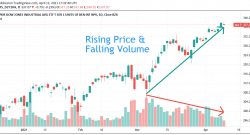
Stock Charts: Rising Price and Falling Volume
April 12, 2021, 1:33 pm EDT Rising Price and Falling Volume Rising price and falling volume is not a bullish pattern from a technical analysis point of view. Especially, it is highly suspicious at the...
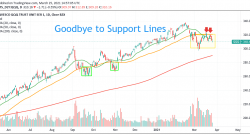
Stock Charts: Goodbye to Support Lines
March 25, 2021, 10:59 am EDT Goodbye to Support Lines It is time to say goodbye to support lines. Technically, support lines represent a key level of defense defined by certain time frames. In the giv...
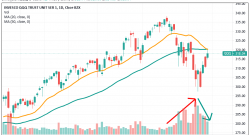
Stock Charts: Low Volume Rebound (QQQ)
March 11, 2021, 9:43 pm EST Low Volume Rebound All indexes scored positive today with Nasdaq the largest +2.5% gains as a rebound. However, the volume was much weaker than the drop as shown. The pri...
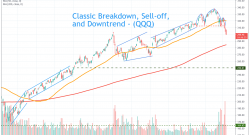
Stock Charts: Classic Bearish Pattern, Breakdown, Sell-off, and Downtrend (QQQ)
Nasdaq or Nasdaq100 enjoyed much fun during the past 12 months since March 2020.
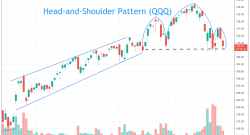
Stock Charts: Head-and-Shoulder Pattern – (QQQ)
March 3, 2021, 12:17 pm EST Head-and-Shoulder Pattern – (QQQ) Watch out classic head-and-shoulders pattern is formed for Nasdaq100 (QQQ). The neckline is 312. Nasdaq index pattern is very simila...
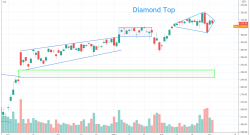
Market Charts: Tough Battle at Diamond Top
Last week two big down days and this week one up one down confused market participants on market direction.
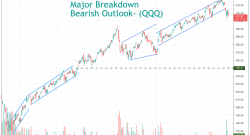
Stock Charts: Major Breakdown and Bearish Outlook (QQQ)
February 25, 2021, 12:43 pm EST Major Breakdown and Bearish Outlook (QQQ) Nasdaq was the weakest index compared to Dow Jones and S&P500. During the boom time, Nasdaq was up quickly, led by AAPL, A...
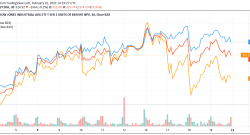
Stock Charts: Technology Lags Behind
February 22, 2021, 9:20 am EST Technology Lags Behind Technology lags behind Dow Jones and S&P index since 02/16 as shown in the featured chart (QQQ-orange, SPY-red, DIA-blue). AAPL, TSLA, FB, MS...