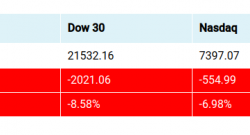
sp500
Charting Update
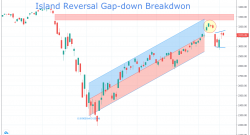
June 17, 2020, 8:22 pm EDT Charting Update Last Thursday 06/11 gap-down, breakdown, island reversal offered an ideal observation point for the next move of the stock markets. Here are follow-up points...
Another Record: Fastest Decline in History
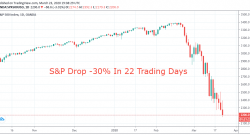
03/23 Corona virus creates another record for stock market in 2020. S&P lost more than -30% from record high with only with only 22 trading sessions. It beat previous records occurred on 1929, 193...
Markets Keep Plummeting
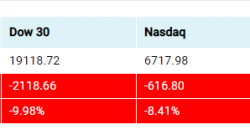
03/18 Stock markets, oil and commodities keep plummeting in fast speed that trigger circuit breaker of -7% about 30 minutes ago. There is no technical support after S&P crossed down 2350. So, next...
Another Low Volume Oversold Rebound
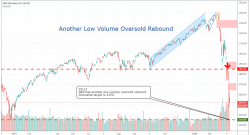
03/13 S&P has another low volume oversold rebound. Downside target is 2350.
Bloodshed
03/12 Bloodshed on stock markets. DJIA and Nasdaq are near support / rebound level but markets keep falling.
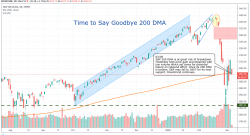
Time to Say Goodbye 200 DMA
03/05 S&P500 200 DMA is at great risk of breakdown. Yesterday high price gain accompanied with low volume which set tones for potential failure on rebound effort. Once its 200 DMA is broken, S&...
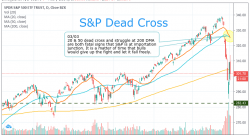
S&P Dead Cross
03/03 20 & 50 dead cross and struggle at 200 DMA are both fatal signs that S&P is at importation junction. It is a matter of time that bulls would give up the fight and let it fall freely.
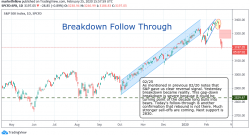
S&P500 Breakdown Follow Through
02/25 As mentioned in previous 02/20 notes that S&P gave us clear reversal signal. Yesterday breakdown became reality. This gap-down breakdown is severe because it could be turning point of the de...
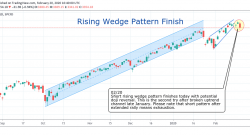
S&P Rising Wedge Pattern
02/20 Short rising wedge pattern finishes today with potential doji reversal. This is the second try after broken uptrend channel late January. Please note that short pattern after extended rally mean...
- 1
- 2