Charts
Chart pattern, indicators, drawing, etc
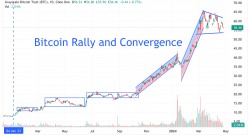
Stock Charts: Bitcoin Rally and Convergence
April 25, 2024, 11:35 am EDT Bitcoin Rally and Convergence Bitcoin and all other cryptocurrencies enjoyed a strong rally from the beginning of 2023. Its ETF (GBTC) price soared from 7 to 65 till April...
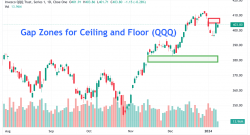
Stock Charts: Gap Zones for Ceiling and Floor (QQQ)
January 9, 2024, 11:15 am EST Gap Zones for Ceiling and Floor (QQQ) Gap zones, either gap-up or gap-down, provide important information for the market reactions on volatile days. These hints are usefu...
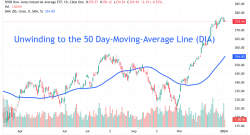
Stock Charts: Unwinding (DIA)
January 3, 2024, 10:44 am EST Unwinding (DIA) The stock markets are like a rubber band. It can be stretched and squeezed in such a way that is far from its normal shape. But, this process created tens...
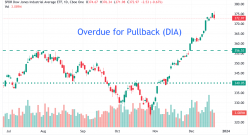
Stock Charts: Overdue for Pullback (DIA)
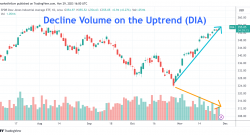
December 20, 2023, 3:42 pm EST Overdue for Pullback (DIA) It is one of the greatest rally with +16% straight-up gains within two months. As shown in the Dow Jones ETF (DIA) chart where we can see the...
Stock Charts: Record Highs Phenomenon
November 29, 2023, 10:53 am EST Record Highs Phenomenon While major indexes are making or approaching the record highs region since about a month ago, it would be important to examine the charts in or...
Late Stage of Convergence Pattern (QQQ)
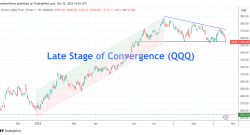
October 22, 2023, 10:35 am EDT Late Stage of Convergence Pattern (QQQ) The Nasdaq 100 ETF (QQQ) made one of the strongest rally in 2023 by reaching about 44% gains in 7.5%. However, QQQ was moving sid...
Stock Charts: Head-and-Shoulder Pattern (QQQ)
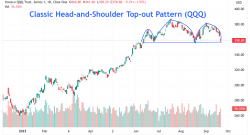
September 21, 2023, 4:05 pm EDT Head-and-Shoulder Pattern (QQQ) One of the most frequent patterns for market participants to see the coming storm is the head-and-shoulder pattern in the stock market. ...
Stock Chart: Medium Trend Line 50 Day-Moving-Average (SPY)
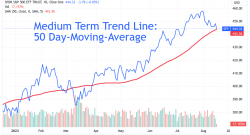
August 15, 2023, 11:02 am EDT Medium Trend Line 50 Day-Moving-Average (SPY) If your timeframe for profit on each trade is about a few weeks or months, then the medium trend would be very important for...
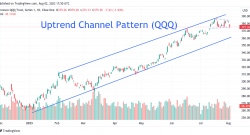
Stock Chart: Uptrend Channel Pattern (QQQ)
August 2, 2023, 1:52 pm EDT Uptrend Channel Pattern (QQQ) Nasdaq or Nasdaq-100 (QQQ) made one of the greatest rallies with more than +40% YTD gains (QQQ) as of today. It formed an uptrend channel pat...

