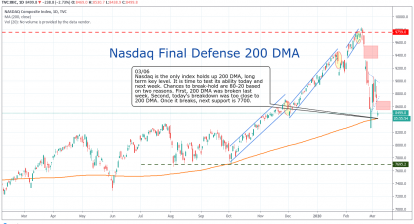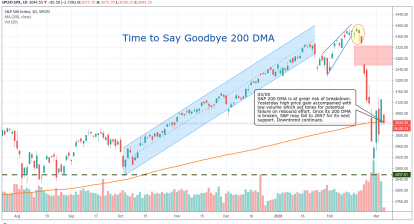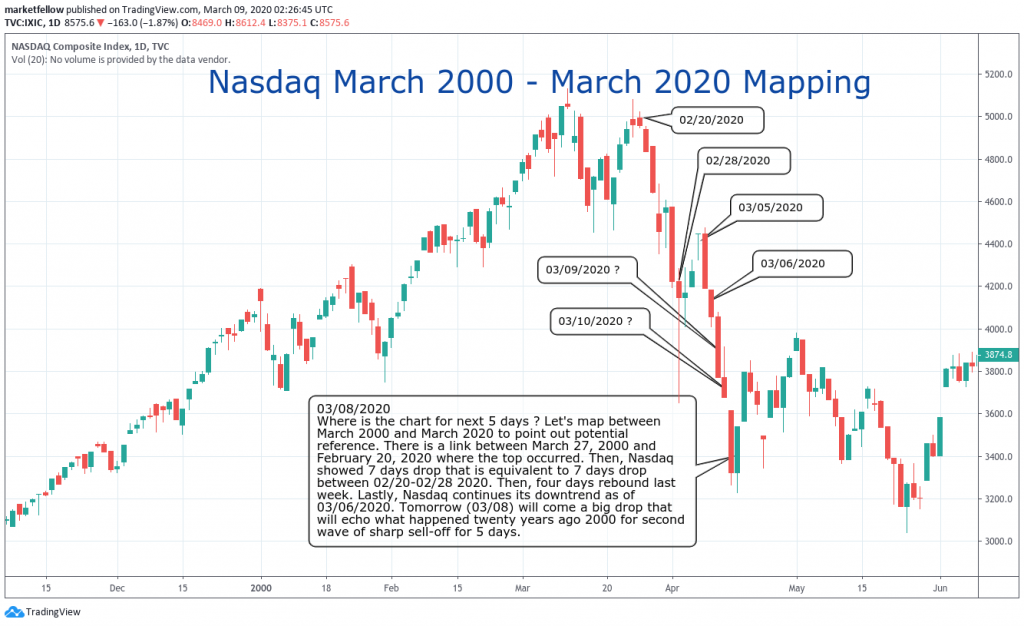
03/08/2020
Where is the chart for next 5 days ? Let’s map between March 2000 and March 2020 to point out potential reference.
There is a link between March 27, 2000 and February 20, 2020 where the top occurred. Then, Nasdaq showed 7 days drop that is equivalent to 7 days drop between 02/20-02/28 2020. Then, four days rebound last week. Lastly, Nasdaq continues its downtrend as of 03/06/2020.
Tomorrow (03/08) will come a big drop that will echo what happened twenty years ago 2000 for second wave of sharp sell-off for 5 days.