Month: March 2020
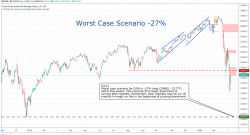
Worst Case Scenario -27%
03/11 Worst case scenario for DJIA is -27% drop (29600 – 21777) within few weeks. This could be first major downtrend of coming bear markets. Remember, bear markets may be 12-18 months in length...
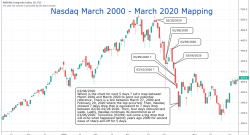
Nasdaq March 2000 – March 2020 Mapping
03/08/2020Where is the chart for next 5 days ? Let’s map between March 2000 and March 2020 to point out potential reference. There is a link between March 27, 2000 and February 20, 2020 where th...
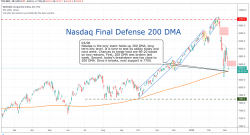
Nasdaq Final Defense at 200 DMA
03/06 Nasdaq is the only index holds up 200 DMA, long term key level. It is time to test its ability today and next week. Chances to break-hold are 80-20 based on two reasons. First, 200 DMA was broke...
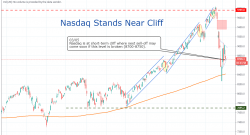
Nasdaq Stands Near Cliff
03/05 Nasdaq is at short-term cliff where next sell-off may come soon if this level is broken (8700-8750).
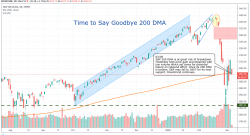
Time to Say Goodbye 200 DMA
03/05 S&P500 200 DMA is at great risk of breakdown. Yesterday high price gain accompanied with low volume which set tones for potential failure on rebound effort. Once its 200 DMA is broken, S&...
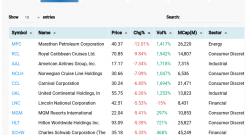
Airliners, Cruises, and Hotels Suffer
03/05 Corona virus keeps getting widespread with rising death numbers worldwide. Following three industries suffer significantly on top of worst performance lists: Airliners: AAL, UAL, ALK Cruises: RC...

Across the Board Rebound
03/04 Across the board rally with DJIA +1173 points were the second thousands points day after big drop last week. Yesterday, Fed lowered interest rate by 0.5% is one factor. The other factor is 8.3 b...
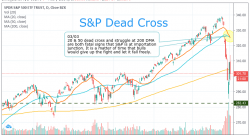
S&P Dead Cross
03/03 20 & 50 dead cross and struggle at 200 DMA are both fatal signs that S&P is at importation junction. It is a matter of time that bulls would give up the fight and let it fall freely.
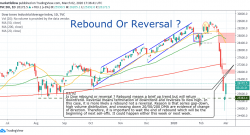
Rebound or Reversal ?
03/02 Is Dow rebound or reversal ? Rebound means a brief up trend but will return downtrend. Reversal means termination of downtrend and reverses to new high. In this case, it is more likely a rebound...