Charts
Chart pattern, indicators, drawing, etc
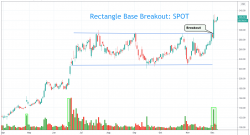
Stock Chart: Rectangle Base Breakout (SPOT)
December 7, 2020, 10:02 am EST Rectangle Base Breakout: SPOT When thinking about buying a stock, it would be reasonable to get in as early as possible from its starting point of its potential uptrend....
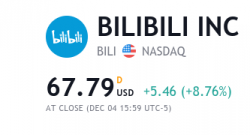
Stock Chart: Entry Point After Breakout: BILI
December 4, 2020, 6:28 pm EST Entry Point After Breakout: BILI Ideal entry point for a target stock is hard to find because it needs to meet the following criteria: Minimal pullback for the short ter...
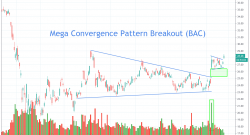
Stock Chart: Mega Convergence Pattern Breakout (BAC)
November 24, 2020, 12:18 pm EST Stock Chart: Mega Convergence Pattern Breakout (BAC) It takes a long time to form a mega pattern. It means a pattern needs to take 6 months or more for full development...
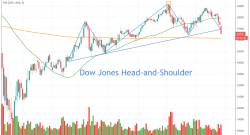
Stock Chart: Dow Jones Head and Shoulder Pattern
October 28, 2020, 1:06 pm EDT Dow Jones Head and Shoulder Pattern Head-and-shoulder pattern is a bearish top-out pattern. In this case, we see a rising angle version of the head-and-shoulder. When th...
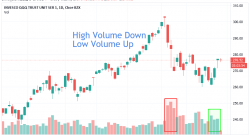
Stock Chart Today: High Volume Down, Low Volume Up
September 29, 2020, 12:57 pm EDT High Volume Down, Low Volume Up After a couple days of rebound, today is down about -150 points in DJIA. Nasdaq holds up better today about flat. Congress $2.2 stimulu...
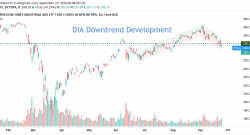
Stock Chart Today: Downtrend Development
September 24, 2020, 8:11 pm EDT Downtrend Development Dow Jones gave up a couple hundred points in intraday trading by ending +52 points as part of rebound effort in the middle of downtrend developmen...
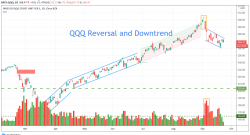
Stock Chart Today: Stay Downtrend Bias
September 23, 2020, 12:34 pm EDT Stay Downtrend Bias Downtrend is being developed after QQQ high volume reversal. Stay bearish bias.
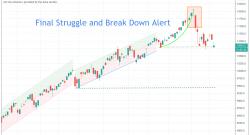
Stock Chart: Final Struggle and Breakdown Alert
Nasdaq does not have much buffer for defense on previous low. Once it breaks down on 10847, the next downside target is 9500. This is a serious breakdown alert.
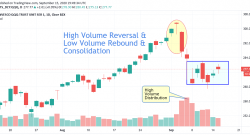
Stock Chart: SideWay Consolidation
September 15, 2020, 4:00 pm EDT SideWay Consolidation After high volume reversal and low volume rebound, stock markets are going sideway consolidation. Using Nasdaq100 QQQ, we can see the range for up...