November 24, 2020, 12:18 pm EST
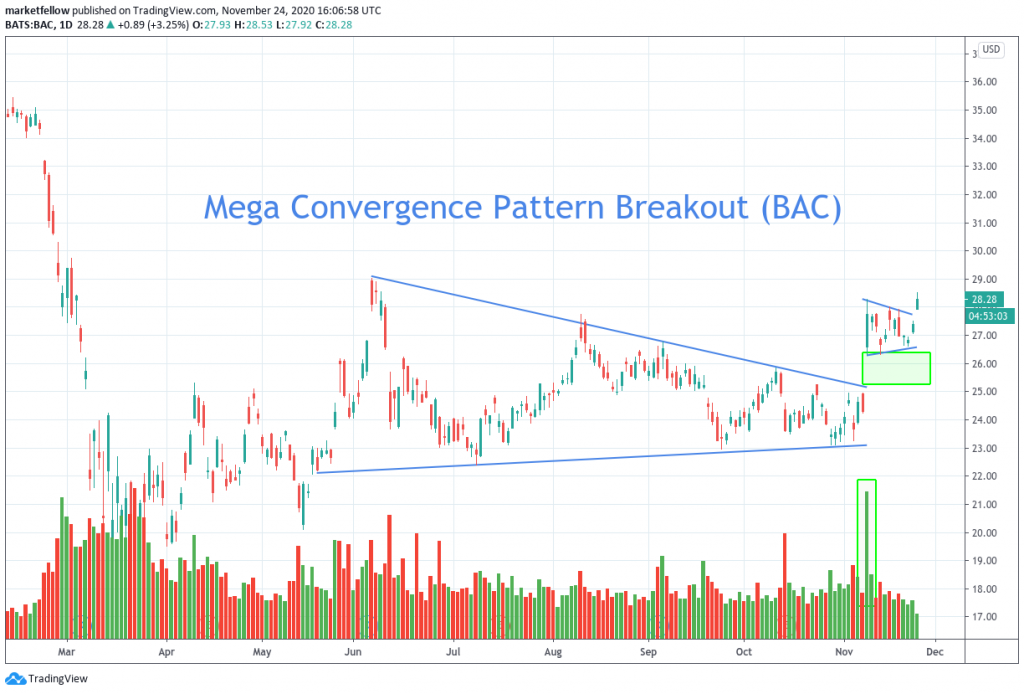
Stock Chart: Mega Convergence Pattern Breakout (BAC)
It takes a long time to form a mega pattern. It means a pattern needs to take 6 months or more for full development, either consolidation or trendy. However, the energy and momentum after long accumulation could be explosive and long-lasting as well. Here is an example of mega convergence pattern with gap-up, high volume breakout from Bank of America (BAC).
- Mega pattern for BAC started from May to November 2020 as shown
- In the beginning, swing was much bigger and volatile. But October showed tight range consolidation. It means that “please be ready for the jump”
- Early November breakout was powerful with gap up and outstanding volume. Even if you missed this one, there is still a chance to enter BAC after breakout. The key point is to find short consolidation for about 1-2 week for entry point. The reason is six month convergence do produce enough power to climb uphill
- Today (11/24), BAC made another strong move with 4-5% intraday gain. We can follow this one to see how it will turn out