December 11, 2020, 12:21 pm EST
Overbought Pullback
It is important to use technical analysis to gauge the status of current market conditions. Stock market has its own rhythms for going up and down so called market timing. This is not a science or a sure thing. But it provides a hint for high probability on certain behaviors.
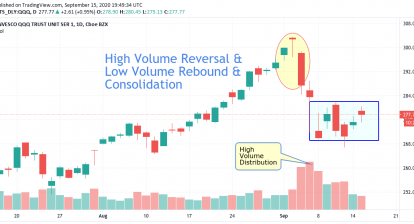
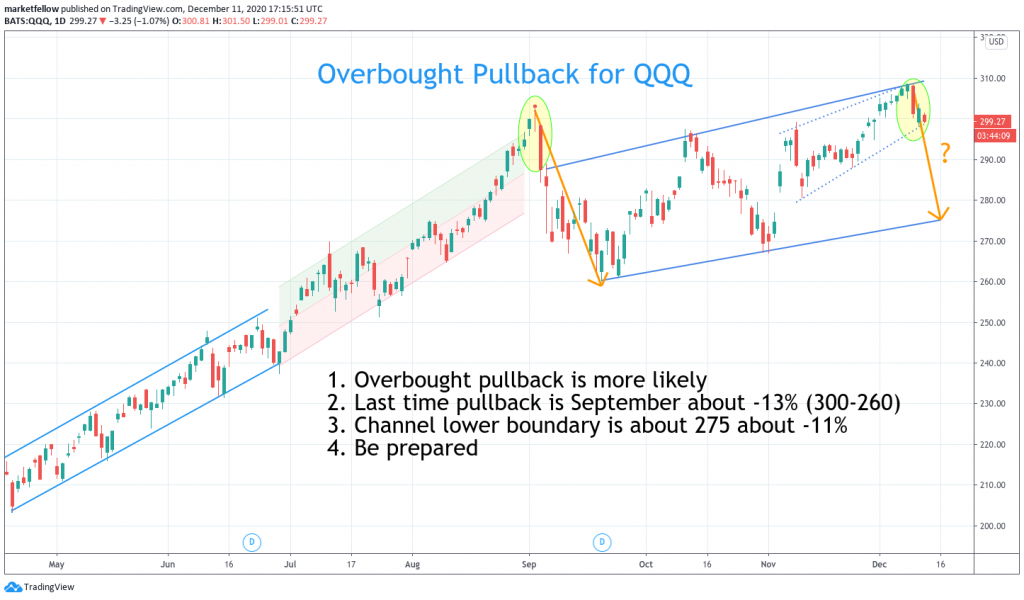
Technology focus Nasdaq is an example to see how marker is doing now as a leading indicator to the downside. We use QQQ, Nasdaq-100 ETF to illustrate our observation:
- Overbought pullback is more likely due to extended rally
- Last time pullback is September about -13% (300-260)
- Channel lower boundary is about 275 about -11%
- Be prepared by taking profits or reducing portfolio positions.Avoid new positions