stock chart
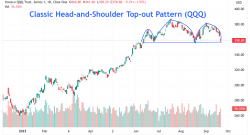
Stock Charts: Head-and-Shoulder Pattern (QQQ)
September 21, 2023, 4:05 pm EDT Head-and-Shoulder Pattern (QQQ) One of the most frequent patterns for market participants to see the coming storm is the head-and-shoulder pattern in the stock market. ...
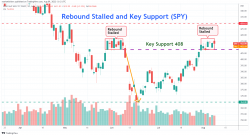
Stock Chart: Rebound Stalled and Key Support (SPY)
August 9, 2022, 9:22 am EDT Rebound Stalled and Key Support (SPY) Rebound stalled again which is similar to the pattern in June as shown for S&P 500 ETF (SPY). This rebound has been strong that c...
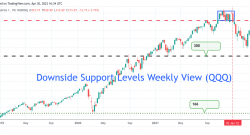
Stock Chart: Downside Support Levels Weekly View (QQQ)
April 30, 2022, 11:53 am EDT Downside Support Levels Weekly View (QQQ) Many people want to know where is the next support when Nasdaq or Nasdaq-100 (QQQ) made a fresh 52-week low yesterday. We will pu...
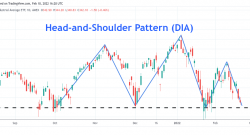
Stock Chart: Head-and-Shoulders Pattern (DIA)
February 18, 2022, 11:30 am EST Head-and-Shoulders Pattern (DIA) The head-and-shoulders pattern is probably the most famous pattern for topping out based on technical analysis on the stock charts. Aft...
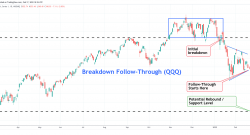
Stock Chart: Breakdown Follow-Through (QQQ)
February 17, 2022, 2:17 pm EST Breakdown Follow-Through (QQQ) Technology-focus index Nasdaq or Nasdaq-100 ( QQQ ) has been in trouble in 2022. The initial breakdown at 382 was fatal and a warning for ...
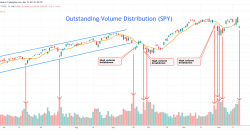
Stock Chart: Oustanding Volume Distribution (SPY)
December 19, 2021, 3:39 pm EST Oustanding Volume Distribution (SPY) Outstanding volume means abnormal or unusually high volume activity on a stock or index for a certain day. It indicates lots of trad...
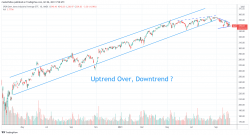
Stock Chart: Uptrend Over. Downtrend?
October 6, 2021, 1:31 pm EDT Uptrend Over. Downtrend? Dow Jones made one of the strongest rallies in 120 years of history producing about +100% return between March 2020 and September 2021 (18 months,...
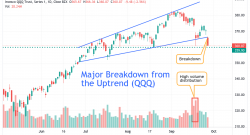
Stock Chart: Major Breakdown from Nasdaq 100 (QQQ)
Today is a major breakdown day for the Nasdaq index. A picture is worth a thousand words as shown in the featured chart (QQQ).
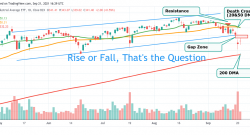
Stock Chart: Rise or Fall? That’s the Question
September 21, 2021, 12:06 pm EDT Rise or Fall? That’s the Question Rise or fall? That’s the question everyone is concerned about after a -600 drop or near -2% down in major indexes yesterday. It...