December 21, 2020, 10:21 am EST
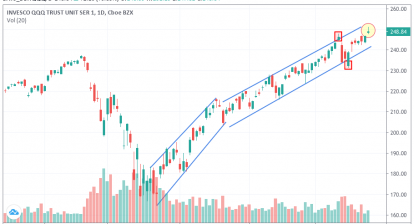
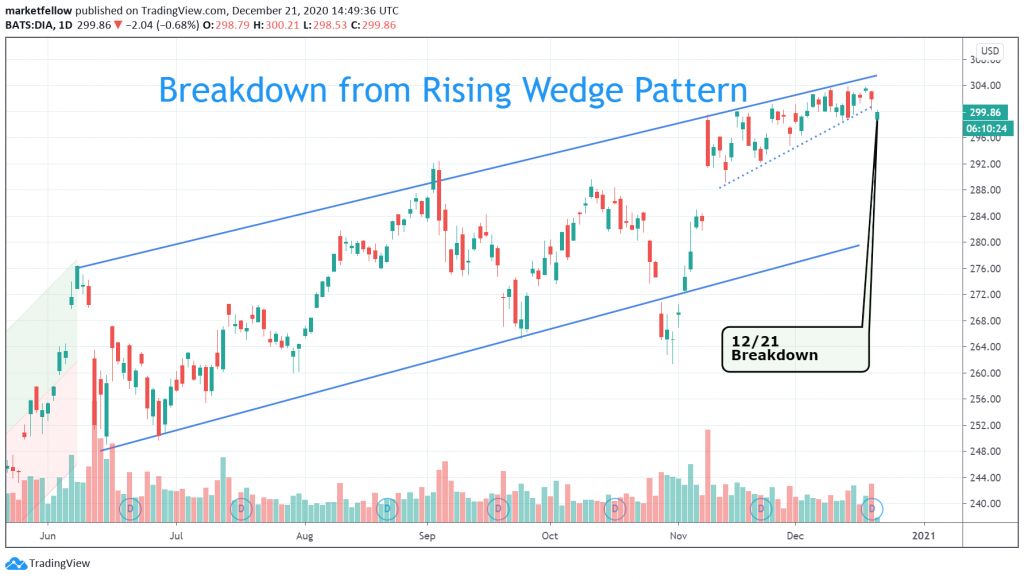
Breakdown From Rising Wedge Pattern
Stock markets made another rally about +15% gain for major indexes (ex: DIA from 264 to 304) in less than two month period (November 1 to December 21, 2020). Series IPOs like Airbnb, Doordash took this opportunity to swallow a big pile of cash. However, charts reveal that it is time to scale back from this mania as “Rising Wedge Pattern”.
Rising wedge is bearish because it shows that the rally is tired and hard to continue. Although new highs still happen, the rates become slower. Thus, breakdown from rising wedges may offer a signal for changing direction.
As shown in the featured chart on DIA that breakdown arrived this morning. Thus, it should serve as a warning or sell signal to end this two month rally.