May 15, 2022, 12:48 pm EDT
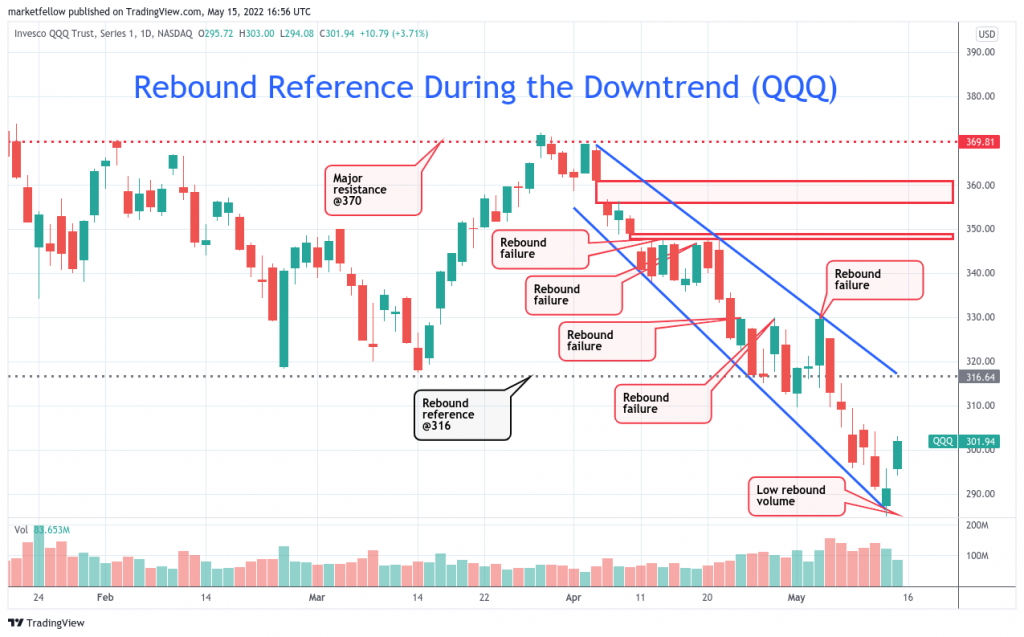
Rebound Reference During the Downtrend (QQQ)
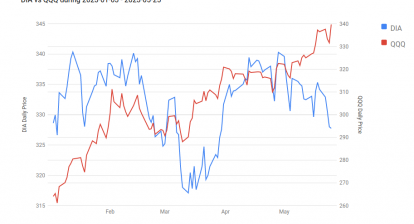
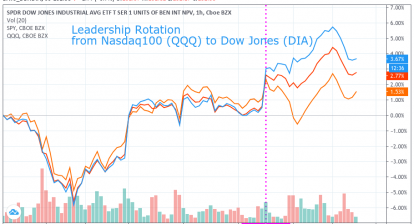
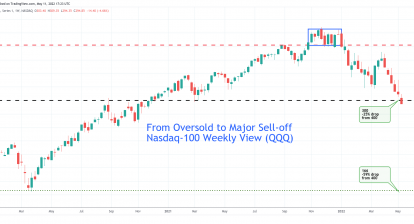
Does the market hit the bottom? Is this a good time to buy? Or, how far the rebound will reach? Those are important questions to be answered after a major downtrend with a -24% YTD loss for Nasdaq100 (QQQ) as shown.
Technically, we can see QQQ is far from over for its major downtrend development for the following reasons:
- Friday (05/13) +3.7% rebound came with a very low volume
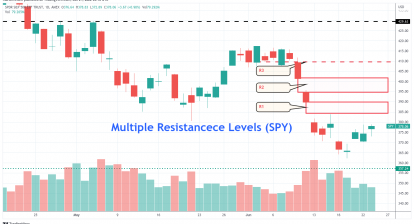
- Many overhead resistance lines or zones to be overcome (360, 350, 316)
- No leadership can be found except oversold rebound
Therefore, there is no reason to believe the bottom is made. Also, it is not a good time to buy or own shares at this level because more sell-off could come at any time. However, it is essential to know where the level that rebound could go if this rebound has some power.
First of all, QQQ needs to climb above its major resistance level 370 which was made at the beginning of April in order to claim a meaningful reversal. In our opinion, it is very unlikely to happen.
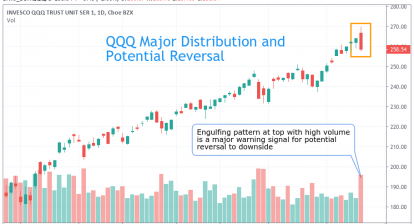
Second, there are two gap-down zones occurred at 360 and 350 levels. Furthermore, there were 5 rebound failures between 317 and 370 areas.
Lastly, on 05/05, the day after FOMC announcement QQQ crossed down 316 decisively and made a strong resistance level at 316.
It means that 316 becomes our rebound reference level to measure the strength of the rebound. The chance is high that QQQ will resume its downtrend when meeting this level. Please also note that 316 is also the upper bound of the downtrend pattern.
In summary, we use 316 as a rebound reference to watch on QQQ.