January 5, 2021, 9:40 am EST
Direction of the US House Price
House prices are a very important factor for many people. It could be the most expensive assets most people have in their lifetime. Thus, it is important to know proper timing to buy or sell a house, either investment or to live. House prices go up and down based on market conditions like stock markets, job markets, demographics, etc. Although no one can exactly predict housing price and its direction, it is much easier to guess or estimate its direction compared to stock markets. This is because housing markets tend to react slower and follow certain economic cycles.
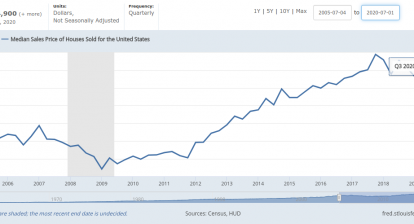
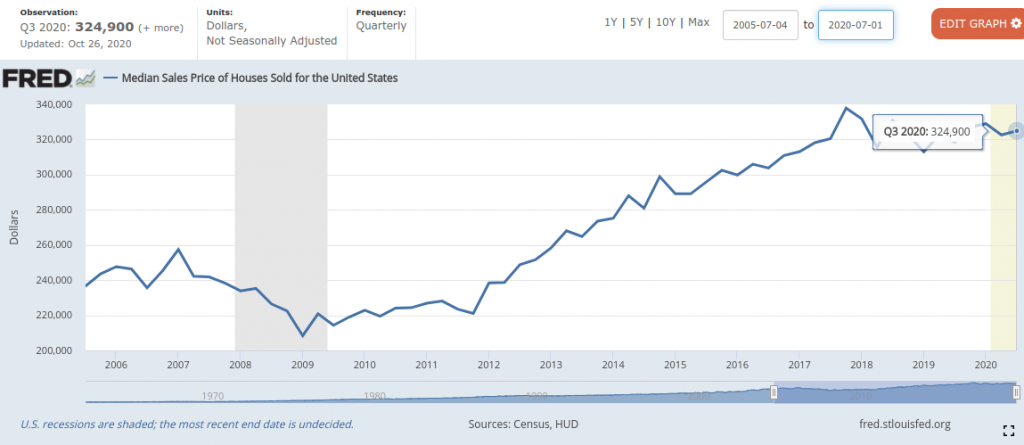
Featured chart is from Fred Economic Data for Median Sales Prices of Houses Sold for the US.
Looking into the last Bull-Bear transition 2007-2009 where prices dropped from 260K to 208K in 2 year timeframes (2007 Q1 — 2009 Q1). It means 20% drop or cheaper if you would buy or sell a house. In reality, some house prices fell more than 30% or 40% at that time. Here we would like to point out correlation where we can get a hint to know what are symptoms or data to watch so that we can prepare for its coming.
- Stock Market Index: This is the most reliable data we can use. Stock market goes up, house prices go up and vice versa. The key is to watch its latency which is about 6 months to 12 months. It means that when a stock market index like Dow Jones or S&P 500 falls into bear market (-20%) from its peak, house prices would follow its downtrend about 6-12 months later.
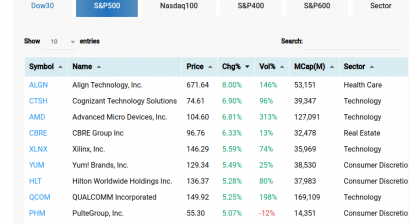
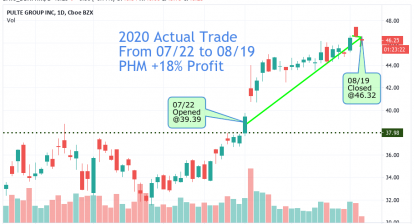
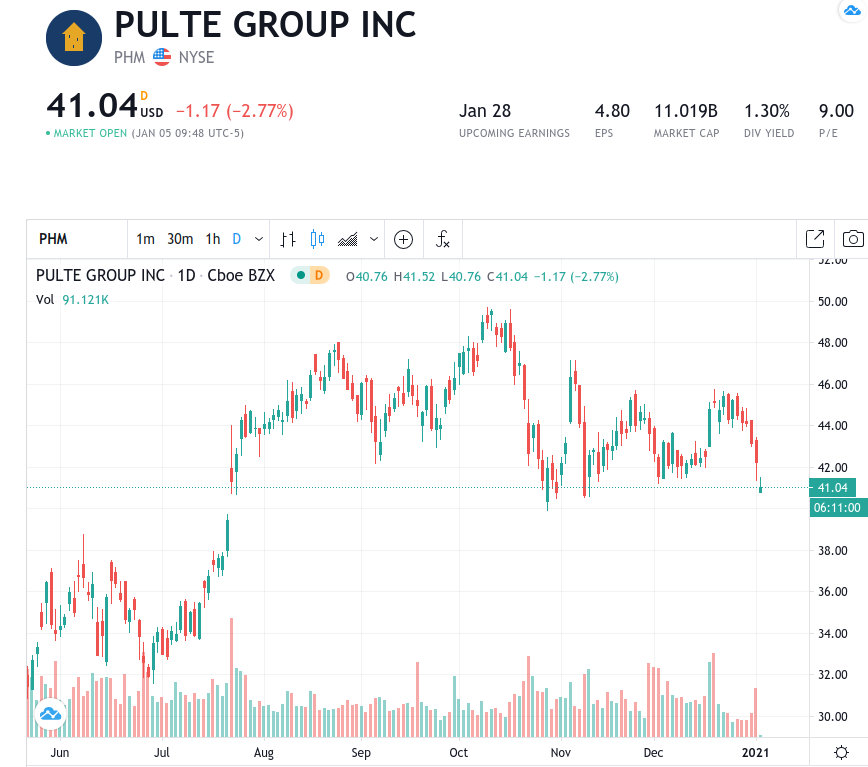
- Home Builder Stock Prices: Home builder stocks like: PHM, NVR, DHI, LEN, TOL, KBH reflect their stock price with investor confidence for their futures. Thus, checking out their stock performance or finding out its trend change are essential to identify their potential change on house prices. Here we use Pulte Group (PHM) as an example where we can see its bearish top-out pattern, hear-and-shoulder. Its neckline or 42 is about being cut through. This is a bearish pattern that could result in long downtrend. Please check all other home builder prices mentioned above that you may be able to make the same conclusion.
- Economic Data: Economic data like New House starts and permits, existing home sales are also important to watch as these data expose economic conditions about house starts and activities. Usually, this data is about 3-4 month (quarter) closer to house prices.
In our opinion, 10 year housing bulls are getting closer to finish. Simply following the stock market index, home build stock price and economic data will give proper timing for its turning point. If you are a homeowner wants to sell your house or you are a buyer / investor who want to buy a house, getting better timing may help to make or save significant amount of money.