June 18, 2021, 9:54 am EDT
Technical Damage
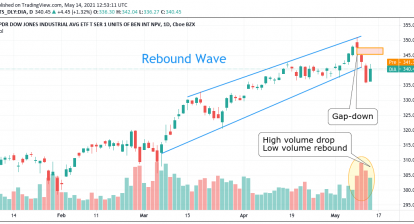
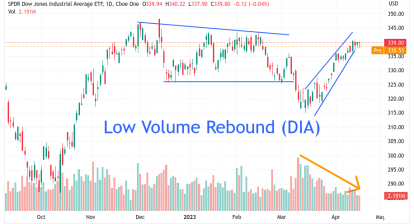
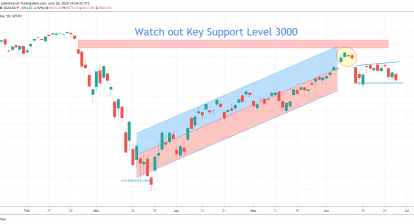
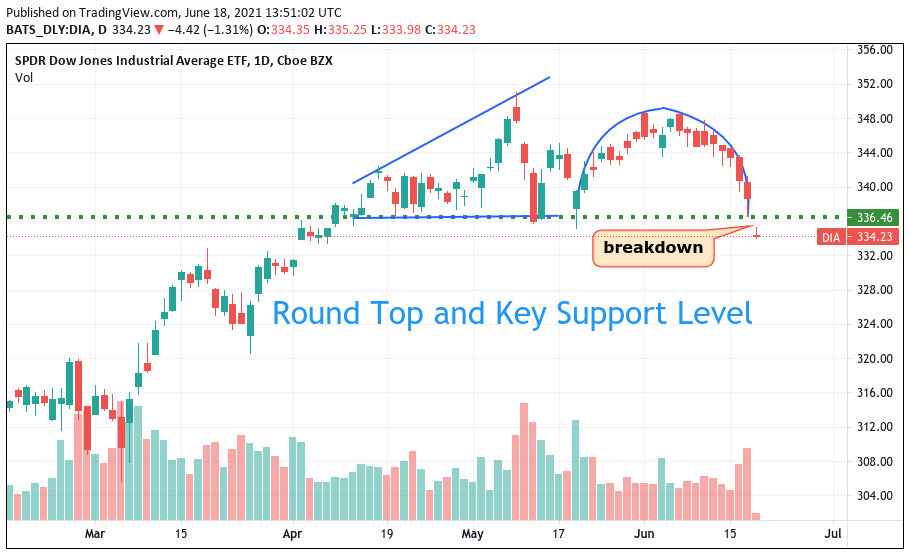
Dow Jones lost another -400 points this morning that caused severe technical damage to its chart as shown (ETF: DIA). Roundtop shape broke its 3-month key support line at 335 where will became its resistance. Not only the uptrend is over, but the downtrend marked its attack with evidence.
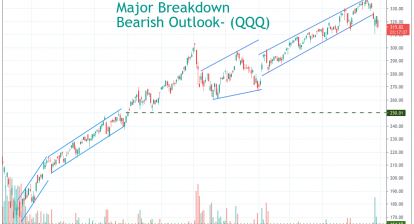
S&P500 and Nasdaq are still in a good shape. So, it is important to monitor these two indexes. If all three indexes form bearish patterns, then we can conclude the bears arrive.