January 27, 2022, 1:15 pm EST
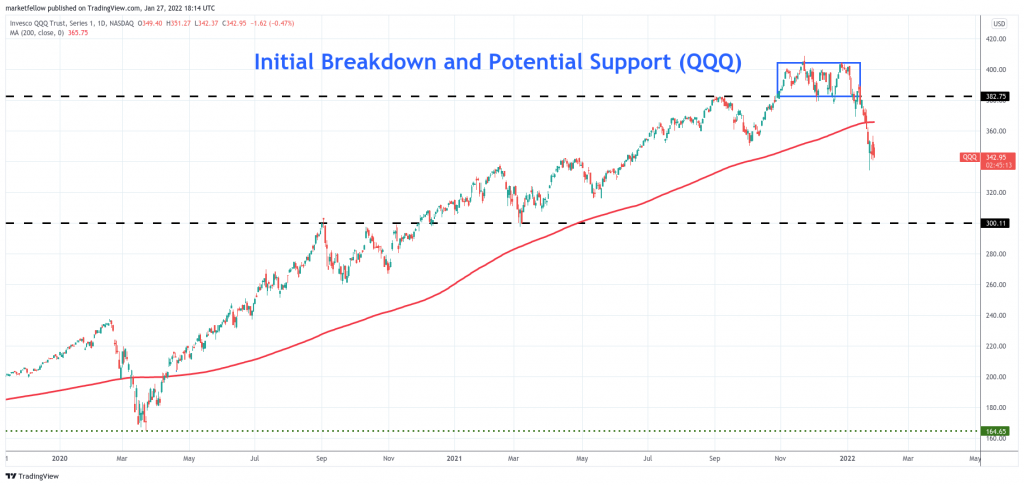
Initial Breakdown and Potential Support (QQQ)
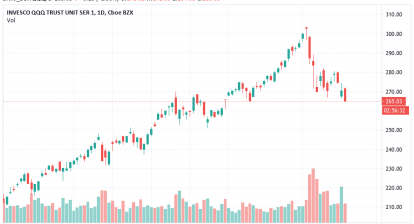
An initial breakdown from the stock markets is confirmed by moving average lines, 20, 50, and 200. It means that short, medium, and long trends point to the downside for all major indexes: DJIA, S&P 500, and Nasdaq. Markets made bearish statements clearly. The question is where is the potential support for this downtrend? Let’s use the leading index Nasdaq-100 (QQQ) to get some hints since Nasdaq is the leader for the way up and also the way down.
From the featured chart, we can see QQQ made the early trouble signal at 382 where it failed to rebound on the lower boundary of the rectangle. Then, after a brief rebound, it quickly crossed out its 200 DMA without gestation. We can conclude at this moment that Nasdaq is in big trouble at the 365 level.
However, QQQ tried to stand up at 340 3 days ago. It should be easy to see 340 is not capable to hold it. For example, TSLA tumbled -8.5% today after the earnings report. In addition, NFLX lost -22% a few days ago. Together with NVDA, AMD, INTC falling, there is not any strength in the Nasdaq and Nasdaq-100 components.
Only technical support down below will be 300 which is both a round number and some peaks and lows were made before. It is a big distance from 340 to 300 or -12% drop. Thus, it would be reasonable to reduce portfolio positions in the Nasdaq index.