November 29, 2023, 10:53 am EST
Record Highs Phenomenon
While major indexes are making or approaching the record highs region since about a month ago, it would be important to examine the charts in order to get an idea on the quality of this rally.
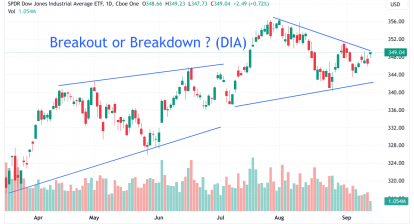
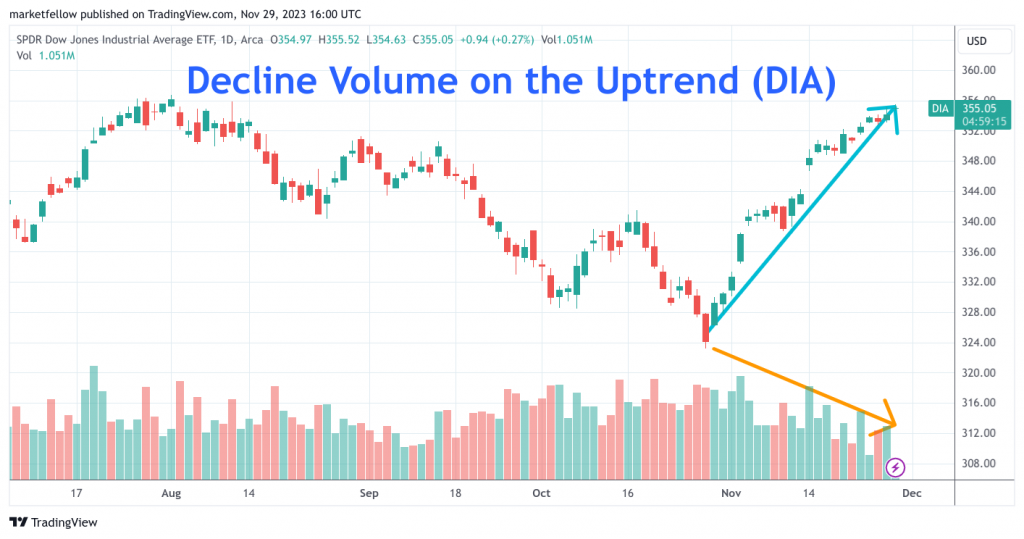
The Dow Jones index scored about +10% gains since late October. But we can see the chart that the volume was in decline pattern during the entire run as shown in the ETF chart (DIA)
It raises a red flag if this is the beginning of another bullish uptrend from the record high ground. In most cases, a strong bull market would be accompanied with a rising volume during the uptrend. It indicates institutional investors are aggressive to enter into the markets. However, it is not the case this time.
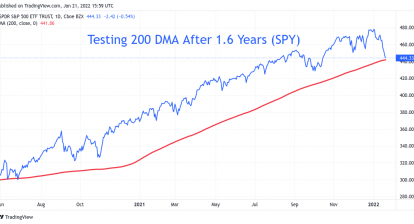
Another pattern we can see from all indexes (DIA, SPY, QQQ) is that the rally comes without justifiable bases. It was a V-shape reversal with multiple gaps in general. It spells out the sudden spikes in response with related news like inflation slowdown and rates hike policy from the Fed.
Obviously, this turn was a surprise for the markets overall.
Combining both technical views we do believe that this rally is unlikely to go far due to the lack of commitment (volume) and solid footing (spike). We believe this is a short-term spike during the long-term decline markets. It could confuse many market participants because the markets are at a record high level.