June 24, 2022, 1:17 am EDT
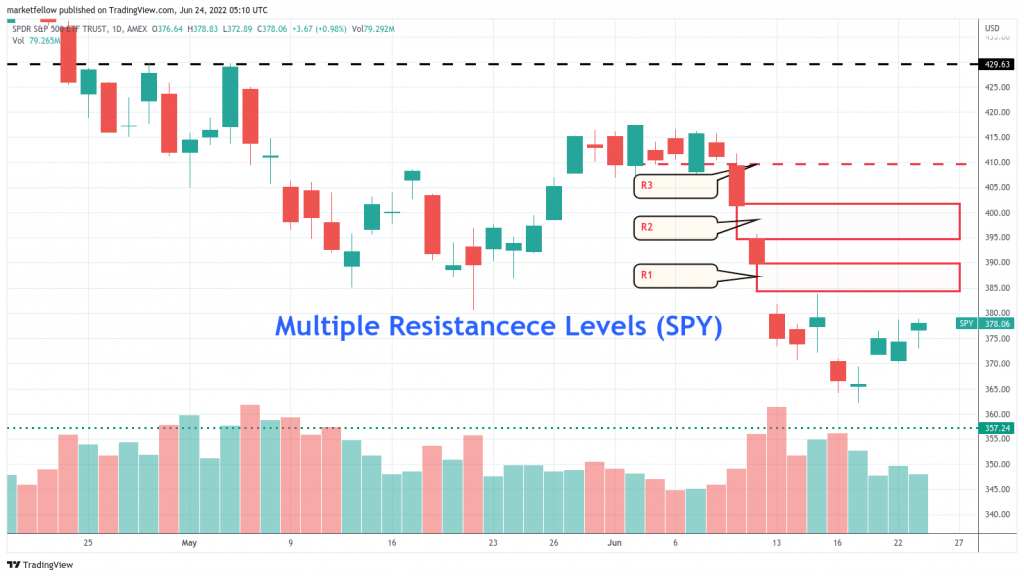
Multiple Resistance Levels (SPY)
Although there were three days of rebound for the stock markets including nearly +1% gains today, the multiple resistance levels are still difficult to overcome.
As shown in the featured chart of S& 500 ETF (SPY), two gap-down zones (390, 400) and one breakdown line (410) are likely to block this rebound effort. It will be surprising if SPY can keep climbing above 430 level. In other words, The rebound should be exhausted within these three resistance levels.
Another observation point is the low volume of activities throughout the rebound days. There is a lack of commitment from the institutional investors to back up the rebound effort.
Thus, we expect to see these resistance levels block the rebound and S&P will turn its direction to continuing its downtrend journey.