June 11, 2020, 6:16 pm EDT
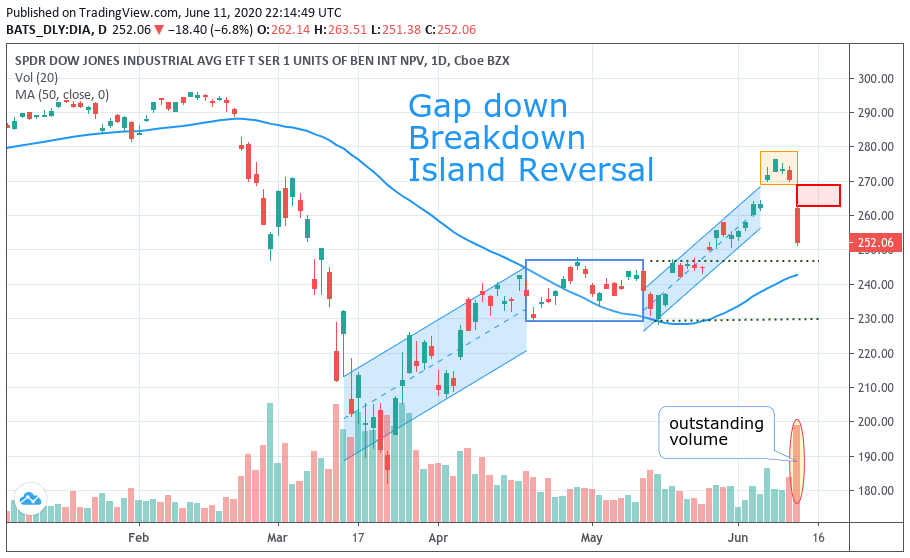
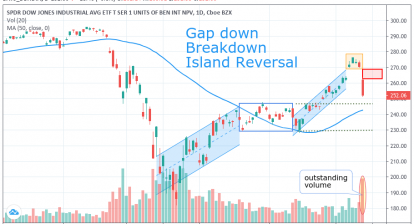
Gap down, Breakdown, Island Reversal
Today is important because it marked the end of the rally since March to yesterday. All major indexes rallied 40-50% during the past 50+ days which is very unusual. From a technical analysis point of view, here are reasons we think the uptrend was over and the downtrend just started.
- Gap-down: Gap down requires significant price differences and physiological change of bias to make it happen. As we can see today’s gap-down was from 300+ points at the opening bell.
- Breakdown: Breakdown can be seen from the previous steady uptrend channel. In this case, the uptrend channel lasts about a month.
- Island reversal: Four lonely bars were left abandoned due to climax run and breakdown. It means that market participants decided to run as fast as possible without looking back. Usually, it means there are more sell-offs to come.
Combining all these factors, today’s down accompanied with significant volume or the highest volume in the past 2.5 months. It should be obvious that direction has changed and more downtrend is on its way.
Now, the question is how to find its support or rebound level. From the given chart, we can see Up-Flat-Up patterns. Therefore, proper support / rebound level should be in the middle of rectangle extension lines. 230-248 zone. We can also see 50 Day-Moving-Average located in the middle of this area.
Thus, we expect there should be more downward pressure in the next 1-2 weeks until the dust settles.

