July 13, 2022, 12:06 am EDT
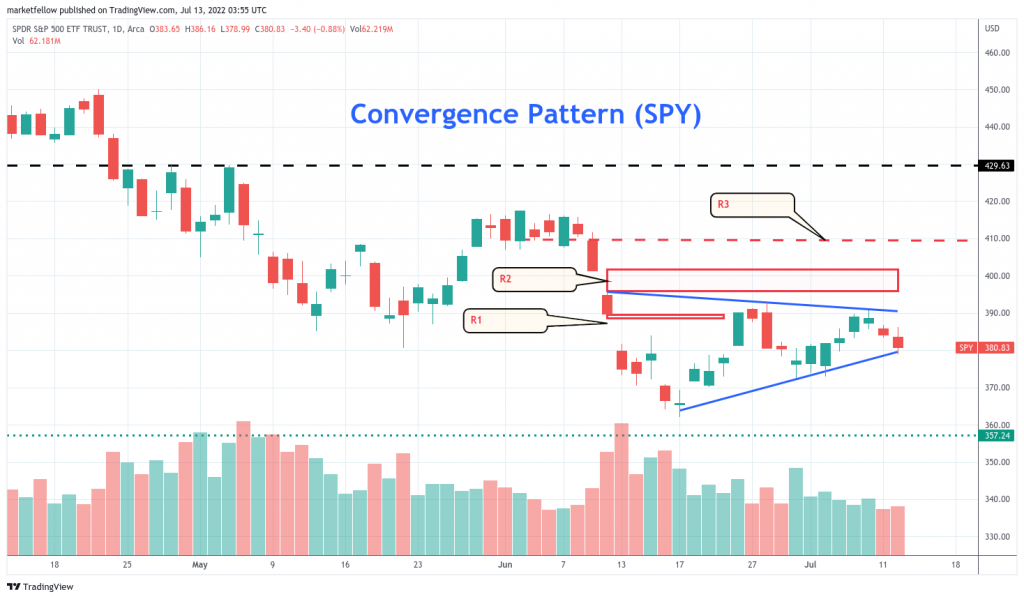
Convergence Pattern (SPY)
After about four weeks of the consolidation process, the stock market comes to a critical junction that appeared in the convergence pattern. As shown in the featured chart of S&P 500 ETF (SPY), we can see clearly that decision time has come.
On the top are two resistant levels 400 and 410 to be ovecome. On the bottom, there is no support except the potential support at 357. Please note that we need to trace back to 2020 to identify it.
Therefore, it should be attention before various data are revealed like CPI, Q2 GDP, and earnings where another major trend is to be unwrapped.