January 21, 2022, 11:00 am EST
Two Down, One To Go
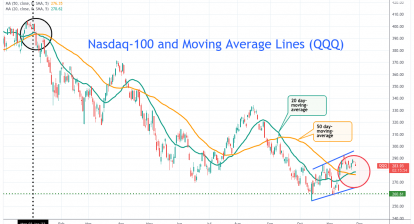
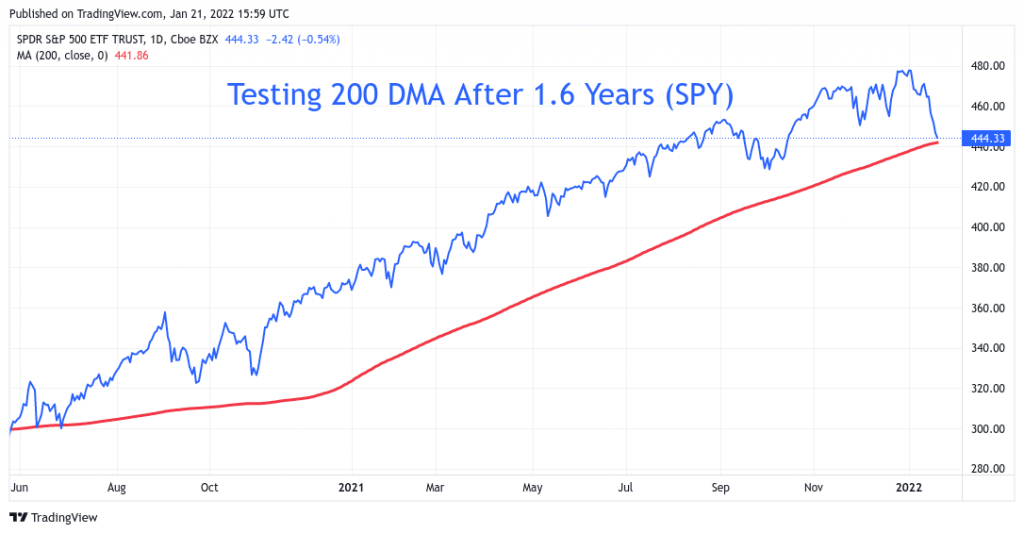
Two major indexes, Nasdaq and Dow Jones are already below their 200 day-moving-average lines. S&P 500 is the only struggle there. This is the first time after 1.6 years since last June that S&P 500 touched its 200 DMA as shown in the featured chart (SPY).
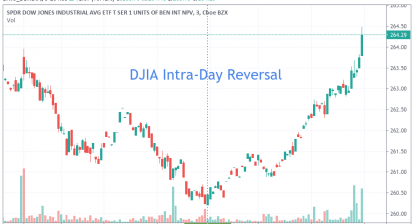
Thus, some market participants decided to get in for a potential oversold rebound. It helps the overall markets to avoid much bigger troubles:
- Netflix (NFLX) tumbled -25% after earning report
- Bitcoin (BTCUSD) lost more than -10% since yesterday
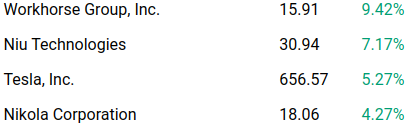
- Amazn (AMZN), Tesla (TSLA) are down about -2.5%
The stock market keeps revealing its symptoms of turning bulls to bears from the technical points of view:
- Risks of losing 200 DMA lines for all major indexes
- Deteriorated breadth readings (MMTH)
- Loss of leadership or change of leadership from offensive (technology, consumer cyclical, communications) to defensive sectors (consumer staples)
- Bearish volume patterns (high on down days, low on up days)
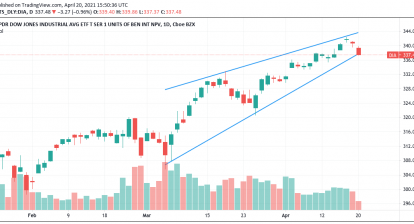
Therefore, markets manifest that the best time of the longest bulls of 12 years may be over by teh beginning of 2022 (DIA). There will be oversold rebound or up and down patterns but the big picture is on the downtrend.
There are still investing opportunities even in the bear markets. So, we will monitor and participate when the timing arrives. In summary, extra cautious is required to maintain profitable portfolio in the bear market.