spy
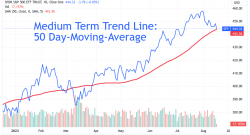
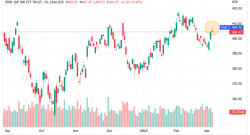
Stock Chart: Medium Trend Line 50 Day-Moving-Average (SPY)
August 15, 2023, 11:02 am EDT Medium Trend Line 50 Day-Moving-Average (SPY) If your timeframe for profit on each trade is about a few weeks or months, then the medium trend would be very important for...
Stock Charts: Overbought condition and Catchup Rally
July 20, 2023, 11:07 am EDT Overbought condition and Catchup Rally It is important to understand the condition of the current market in either overbought or oversold condition so that one can avoid ch...

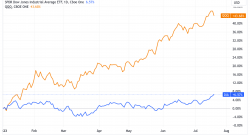
Strategy: Leader vs Laggard
July 15, 2023, 10:41 am EDT Leader vs Laggard What is the performance difference between the major indexes in the US stock market? The answer is 10X. Year-To-Date Performance on major indexes: Nasdaq...
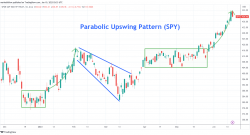
Stock Charts: Parabolic UpSwing Pattern (SPY)
June 19, 2023, 12:06 am EDT Parabolic UpSwing Pattern (SPY) It is always essential to keep calm and cautious after the excitement. When the conditions became overheated, it may turn to the other direc...
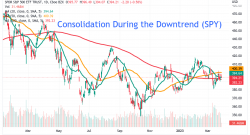
Stock Charts: Consolidation During the Downtrend (SPY)
March 28, 2023, 2:07 pm EDT Consolidation During the Downtrend (SPY) 2023 Q1 (January to March) is going to finish in a few days this week. What is the status and bias of the stock market if someone a...
Stock Charts: Poor Finish
March 6, 2023, 7:30 pm EST Poor Finish The stock market finished today with poor permanence. Although S&P 500 ended with a flat day, it actually gave up all intra-day gains. Technically, it marked...
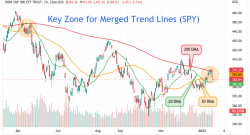
Stock Charts: Key Zone for the Merged Trend Lines (SPY)
January 19, 2023, 10:49 pm EST Key Zone for the Merged Trend Lines (SPY) When different trend lines merged together into a tight zone, we called it a key zone. It means that the key moment may come s...
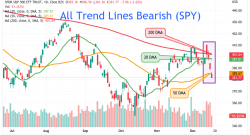
Technical Analysis: All Trend Lines Bearish (SPY)
There is an easy way to know the trend or directions of the stock markets. It is not based on a personal opinion or unclear bias. Simply looking at the moving average lines...
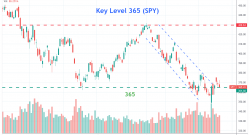
Technical Analysis: Key Level 365 (SPY)
October 20, 2022, 10:37 pm EDT Key Level 365 (SPY) S&P 500 ETF (SPY) broke the 365 level about a month ago. Then, it swings in both directions for almost a month without progress. It is important ...