November 28, 2022, 2:14 pm EST
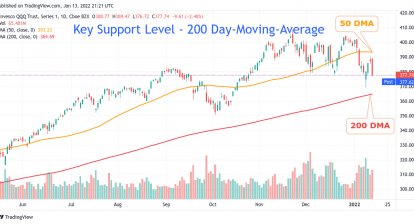
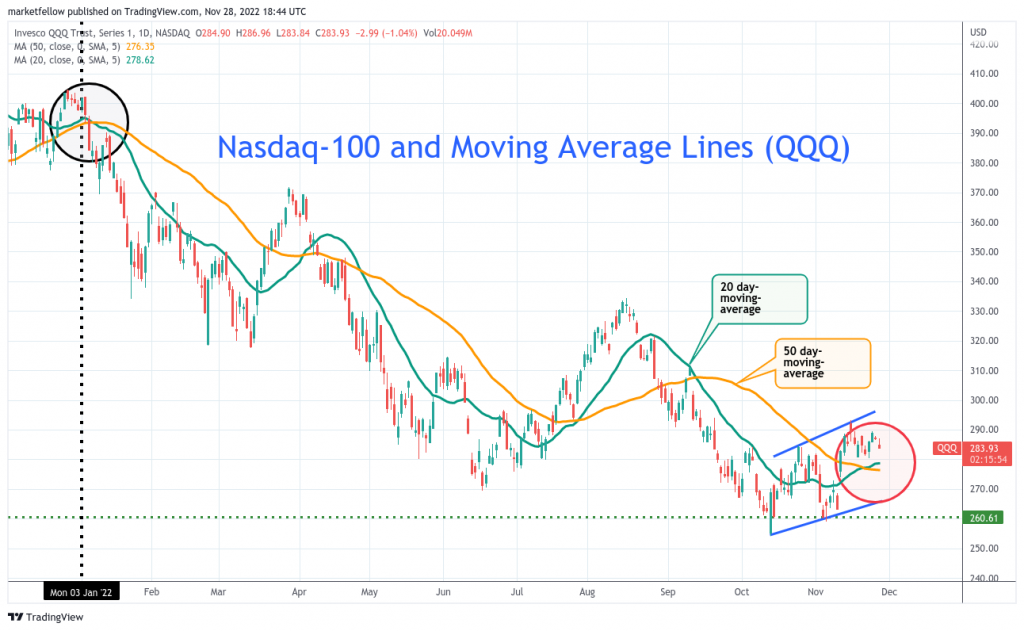
Nasdaq-100 and Moving Average Lines (QQQ)
Nasdaq and Nasdaq-100 are the leaders when bulls are in charge of the upside. But, they are also leaders in the bear markets when plunging. Thus, it is a valuable tool to monitor Nasdaq or Nasdaq-100 (QQQ) on their moving average lines in both markets to get a sense of market sentiments.
For example, using the short-term (20) and medium (50) day-moving-average lines on Nasdaq-100 (QQQ) we can visualize easily the bull-bear transition on the featured chart.
On 01/03/2022, 20 DMA crossed down 50 DMA on QQQ (black circle) where it served as the earliest signal on Nasdaq’s trouble. Especially, QQQ failed to reclaim its bullish status back after more than 1-2 weeks. Definitely, it was a major warning signal.
There were a few weeks in April and August when the 20 DMA line was above the 50 DMA line. Overall, bears dominated most of 2022 for QQQ.
Now, we can see the latest rebound from mid-October carried QQQ to near neutral bias which means both 20 & 50 DMA merged together (red circle). Therefore, it is very important to watch how Nasdaq would react on both lines.
Simply looking at the trend (downtrend) and weakness of the Nasdaq the feeling is bearish. It means that if Nasdaq falls below both lines the bears would come back again. It is likely to bring Nasdaq and Nasdaq-100 to new lows. Also, another major downtrend could follow up.