February 5, 2022, 8:08 pm EST
Squeezed Between Short and Long Term Lines (SPY)
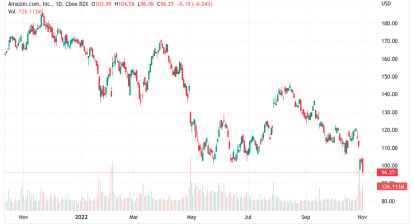
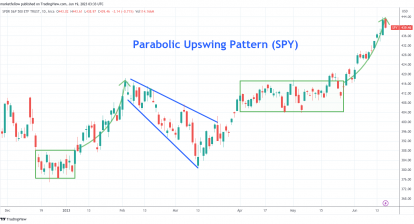
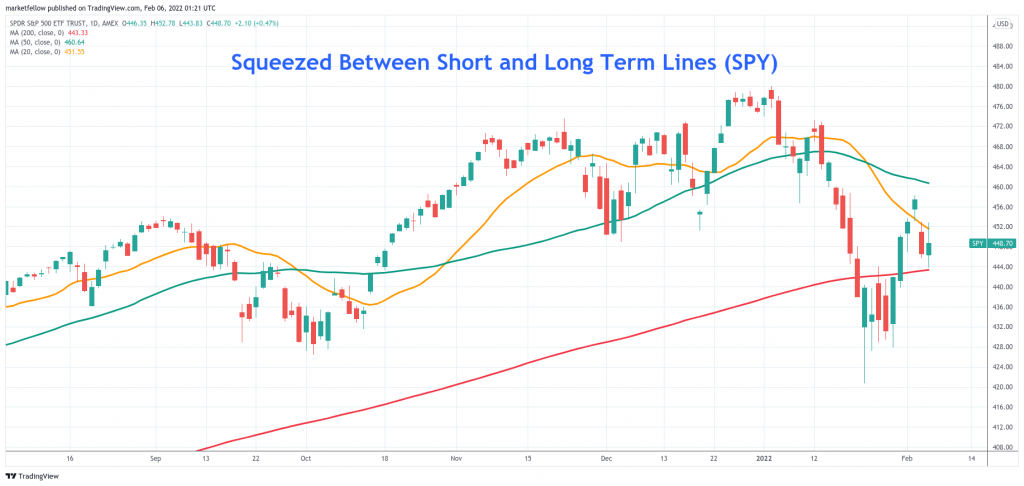
The past 1-2 week was full of wild actions caused by earnings reports (AMZN, FB, GOOGL, NFLX) where major indexes settled into the middle ground. S&P 500 and Dow Jones were both squeezed between the long-term line (200 day-moving-average) and the short-term line (20 day-moving-average). Thus, it is neither bullish nor bearish based on their charts.
It helps us to re-exam the current status of the stock markets where bulls and bears are roughly equal in power. However, Nasdaq is in a worse situation because it falls below all average lines (20, 50, 200). Therefore, it would be safer to reduce holding positions in the technology stocks.
January non-farm payroll increased by 467,000 with the unemployment rate as low as 4.0%. It means the US job markets are still solid under inflation, COVID-19, supply-chain interruption conditions. This situation will be tested through a higher rates environment very soon. We should always keep in mind this coming threat.
Meantimes, there are some industries that are still very strong:
- Bank: WFC, BAC
- Energy: HES, APA, MRO
- Agriculture: CTVA, CF, MOS
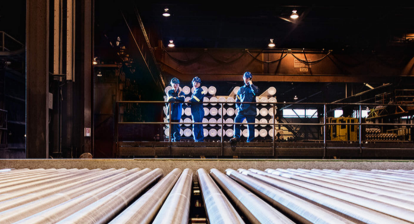
- Material: AA
In summary, we can use S&P500 and Dow Jones relative positions with respect to their average lines (20,50,200) to judge their bias if the changes appear.
Stay cautious on the market and focus on the leaders.