May 21, 2022, 12:00 pm EDT
How far and how long the Nasdaq could go?
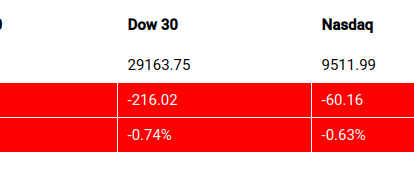
It should be the right time to discuss these questions that many people want to know. How far and how long the Nasdaq could go in this bear cycle? Indeed, Nasdaq falls by 27% in 2022 which is technically a bear market. Sometimes, market participants want to see the bottom come sooner and shallower. But, what is the reality?
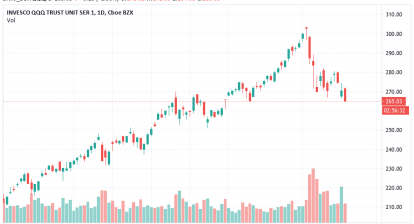
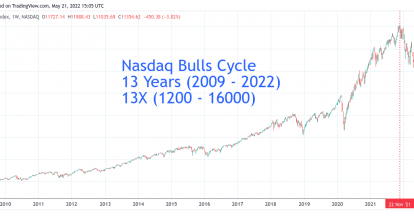
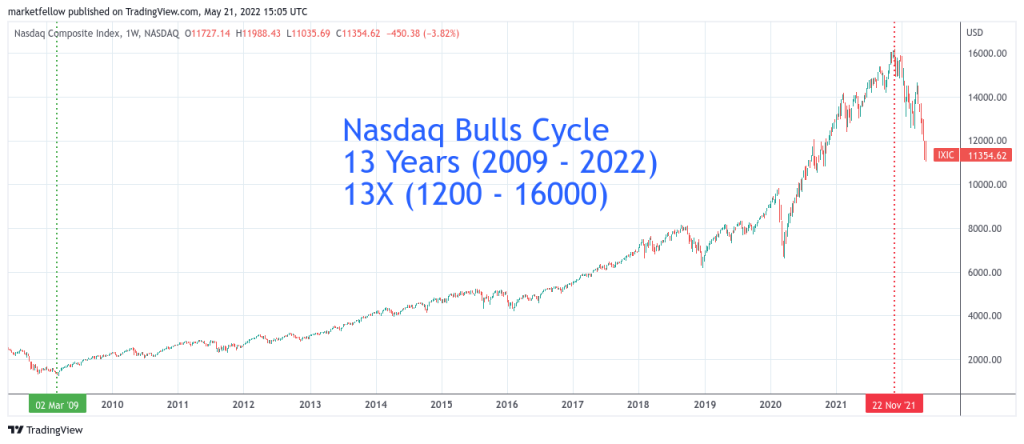
As shown in the featured chart, this bull’s cycle is 13 years in duration (2009-2022) which is the longest one in the past 120 years of history (Dow Jones record). Its value becomes 13X. Simply look at these mega-caps we can see their marvelous performance: AAPL, AMZN, GOOGL, TSLA, FB. However, these mega-caps also suffered a significant drop recently. Thus, it would be interesting in knowing what could be the worst-case scenario using the past bear market as a reference.
We will use the Nasdaq year 2000 bulls and bears for comparison.
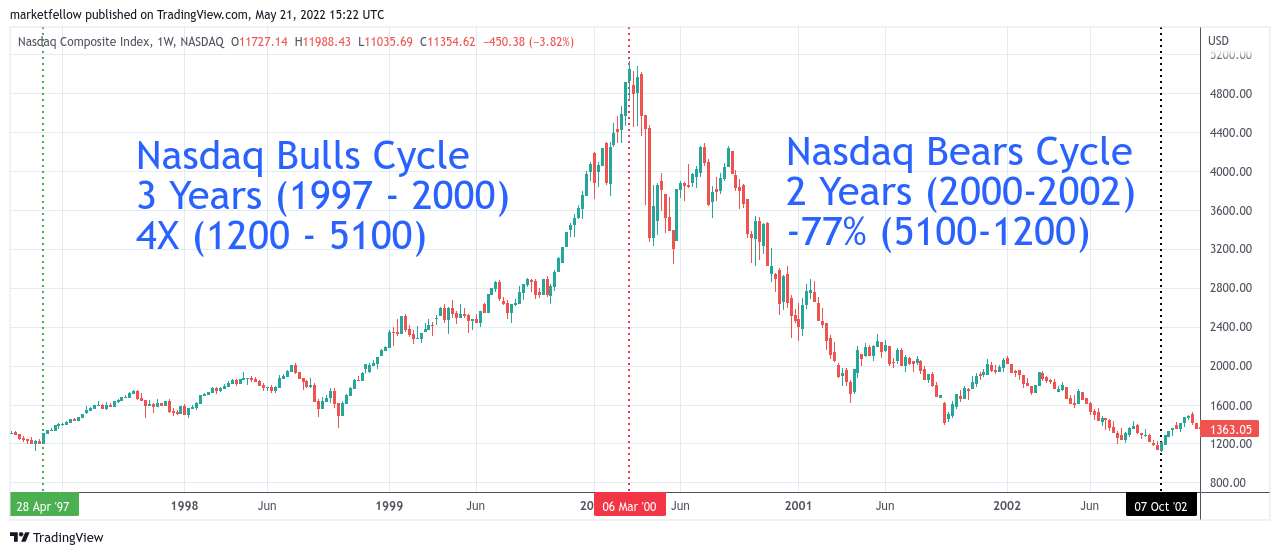
Here we can see that Nasdaq made strong gains. Its value became 4X (1200-5100) in 3 years (1997-2000). After it top-out, Nasdaq quickly withdrew about -30% (from March to June 2000). However, this was only the initial stage of the bear markets. Eventually, Nasdaq dropped -77% in the next two years to fully reset all the gains (5100 – 1200). For the next five years (2002-2007) Nasdaq up-and-down back to 1200. It took a total of 15 years (2000-2015) for the Nasdaq to reclaim its 5100 level.
Although this time may not be the same situation, history provides an objective viewpoint to balance our emotions (greed, fear, hope) during the bulls and bears market. When we know what could be the worst situation, we would better prepare ourselves that eliminate the greed, quench fear, and shine hope for our continual battles in the stock markets.