August 2, 2023, 1:52 pm EDT
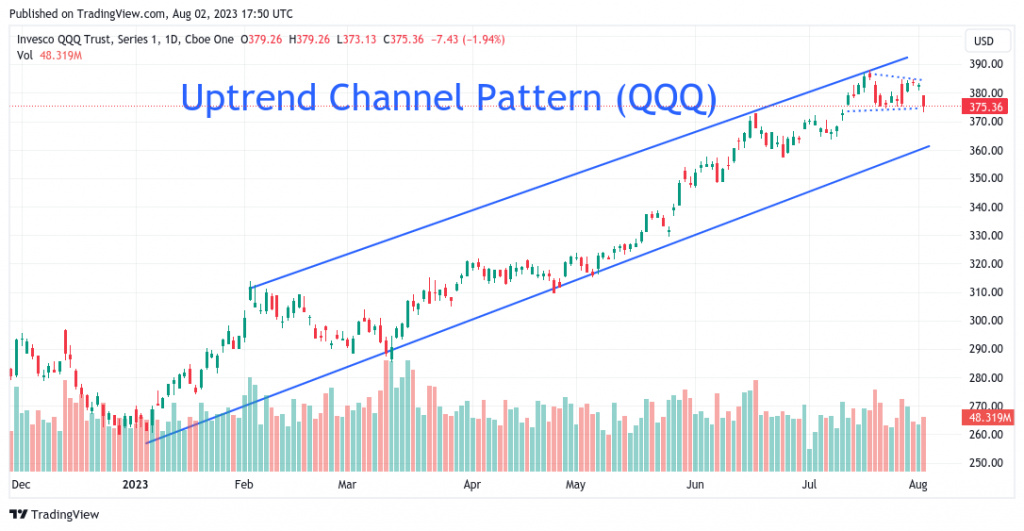
Uptrend Channel Pattern (QQQ)
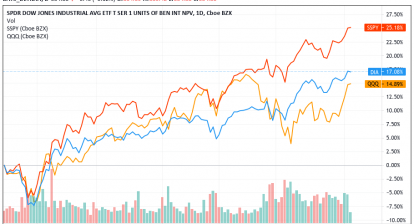
Nasdaq or Nasdaq-100 (QQQ) made one of the greatest rallies with more than +40% YTD gains (QQQ) as of today.
It formed an uptrend channel pattern since the beginning of 2023 as shown.
Although it looked great, it is hard to catch at that moment when layoff news was everywhere and COVID-19 restrictions were still in place. Also, rising rates and inflation made people nervous about the outlook for 2023. However, it is how the stock market works. The rally will come when most people do not prepare. The other way is also true. It will finish when most people feel excited about the rally.
Yes. The AI topics shine MSFT, META. GOOGL, AMZN, AAPL, NVDA, AMD. Electric cars also boost TSLA. But, it is important to remember that the rally will finish suddenly without notifications.
Therefore, let’s use the chart to give us some signals so we know the risks are coming.
One easy way to check whether the trend would continue or finish is to use the pattern. Here we can see QQQ made an uptrend channel with two parallel lines that connect the major tops or bottoms throughout the entire 2023.
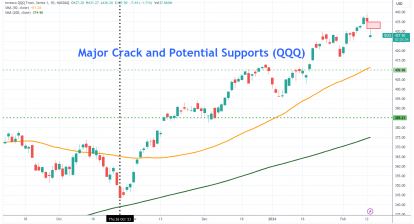
Then, we can use the lower channel line to determine if the trend is over. From this chart, it is about 360 for the long-term trendline. If we use a shorter trend pattern, then we can see the dash lines. It indicates that today could be the day it turns down after consolidation. In other words, the short-term trend became bearish first while long-term bias is still bullish.
So, the strategy should be geared toward the defensive by reducing risks for the short term and watching out for breakdown signals for the long-term.