January 19, 2023, 10:49 pm EST
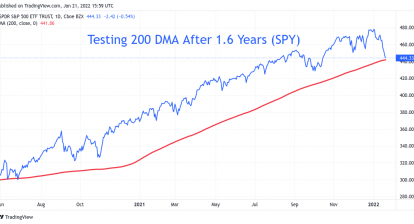
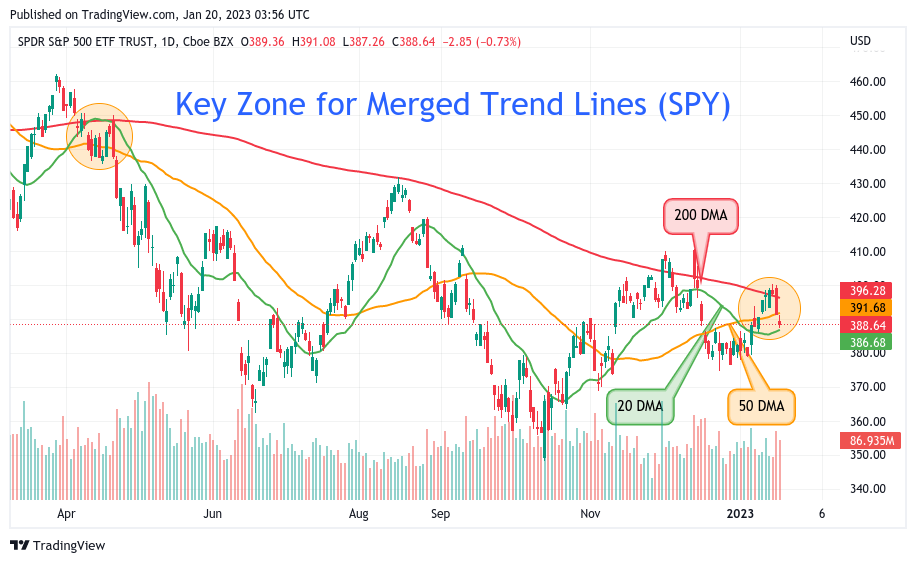
Key Zone for the Merged Trend Lines (SPY)
When different trend lines merged together into a tight zone, we called it a key zone.
It means that the key moment may come soon to take the direction of its next move when moving out of this area. As shown in the featured chart for S&P 500 ETF (SPY), we annotated the three trend lines with the key circles.
- Short-term: 20 Day-Moving-Average (green line)
- Medium-term: 50 Day-Moving-Average (orange line)
- Long-term: 200 Day-Moving-Average (red line)
The last time the merged area is on the left-hand side was in April 2022 about 9 months ago. We can see clearly that once it got out of the circle, SPY moved downward consistently for the next nine months.
Now, these trend lines came together again as shown in the orange circle on the right-hand side.
It indicated that a new direction may come when consolidation reaches the late stage. In other words, it is time to pay attention to the coming action. We do not know whether it is an up or down. But, it could be another trend development when SPY moves out of the key zone.
Thus, we should be alert.