October 20, 2023, 10:25 am EDT
Inverted Yield Curve Bottom Out
One of the most reliable indicators for a bear market or recession is the inverted yield curve.
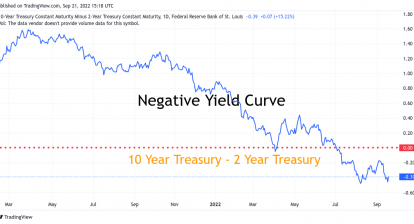
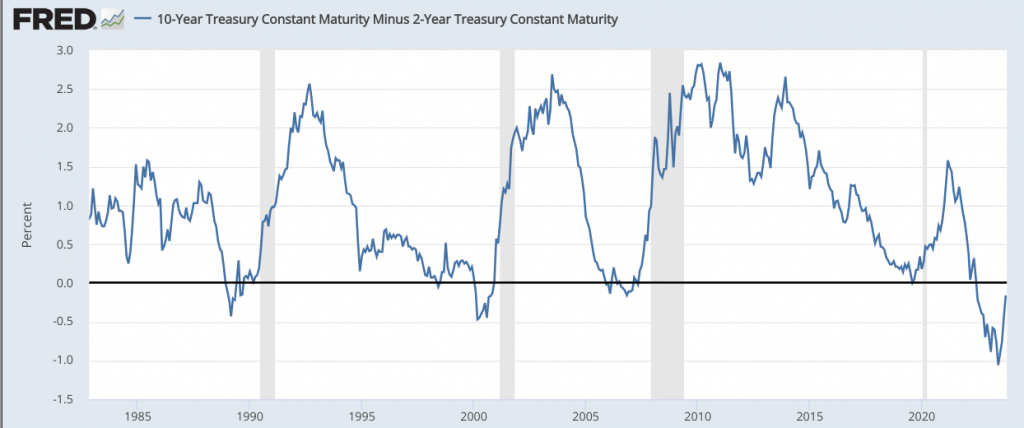
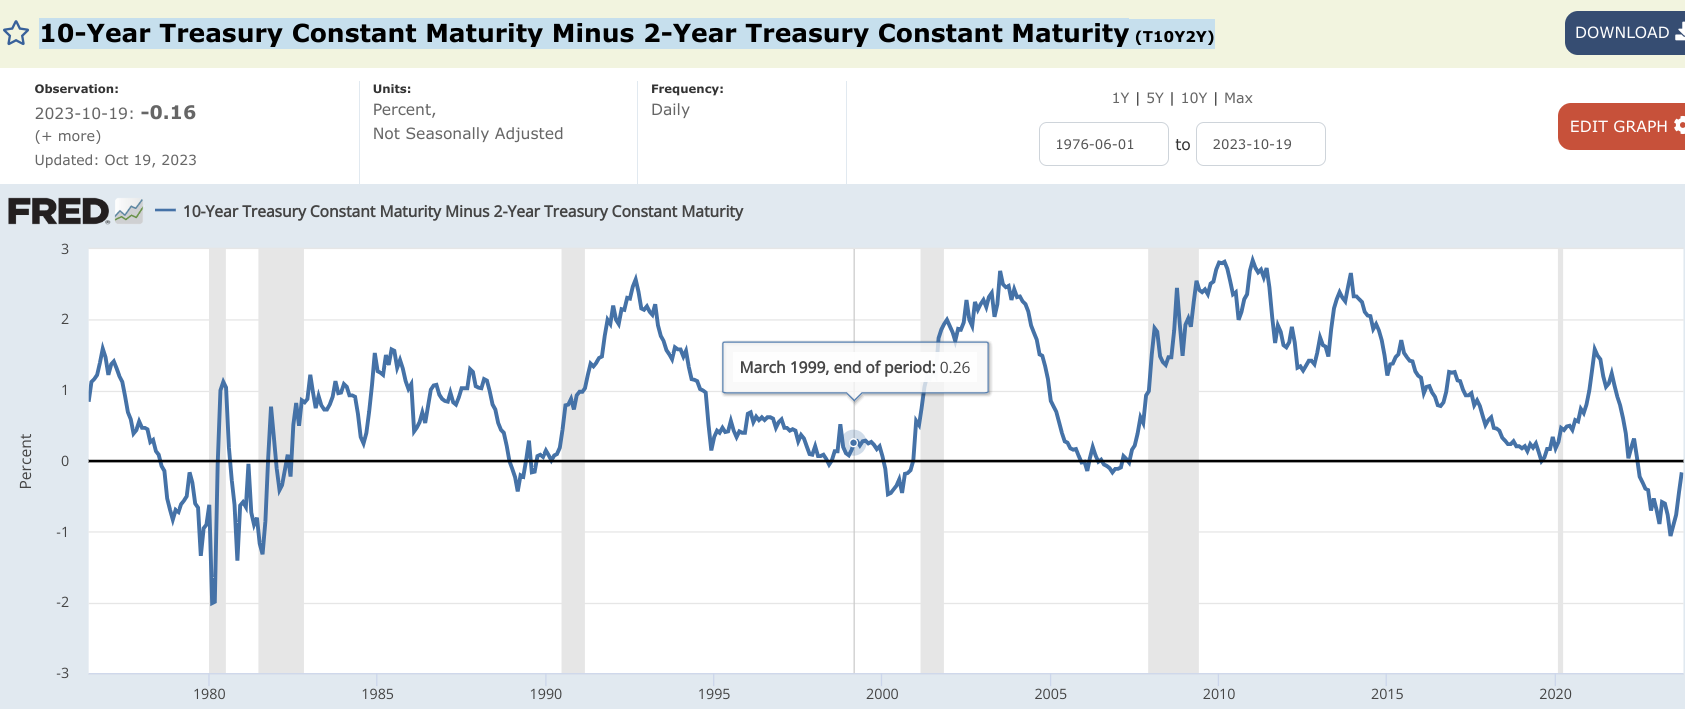
10-Year Treasury Constant Maturity Minus 2-Year Treasury Constant Maturity (T10Y2Y)
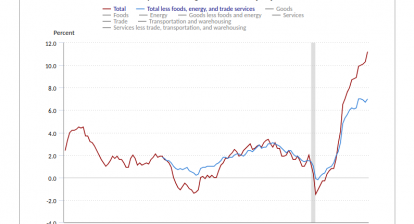
Usually, the yield of the longer term bond (10 years) is higher than the shorter term bond (2 years). But, it could be inverted in the stress market condition like we are going through since July 2022. It means inflation pressure is present and the long term picture bearish. Even when it happens, this condition will not last very long. It will be back to normal after a painful wash out or difficult financial markets.
Thus, using this indicator could prepare us for the coming storms.
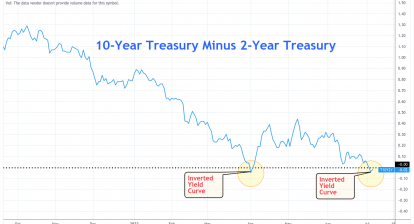
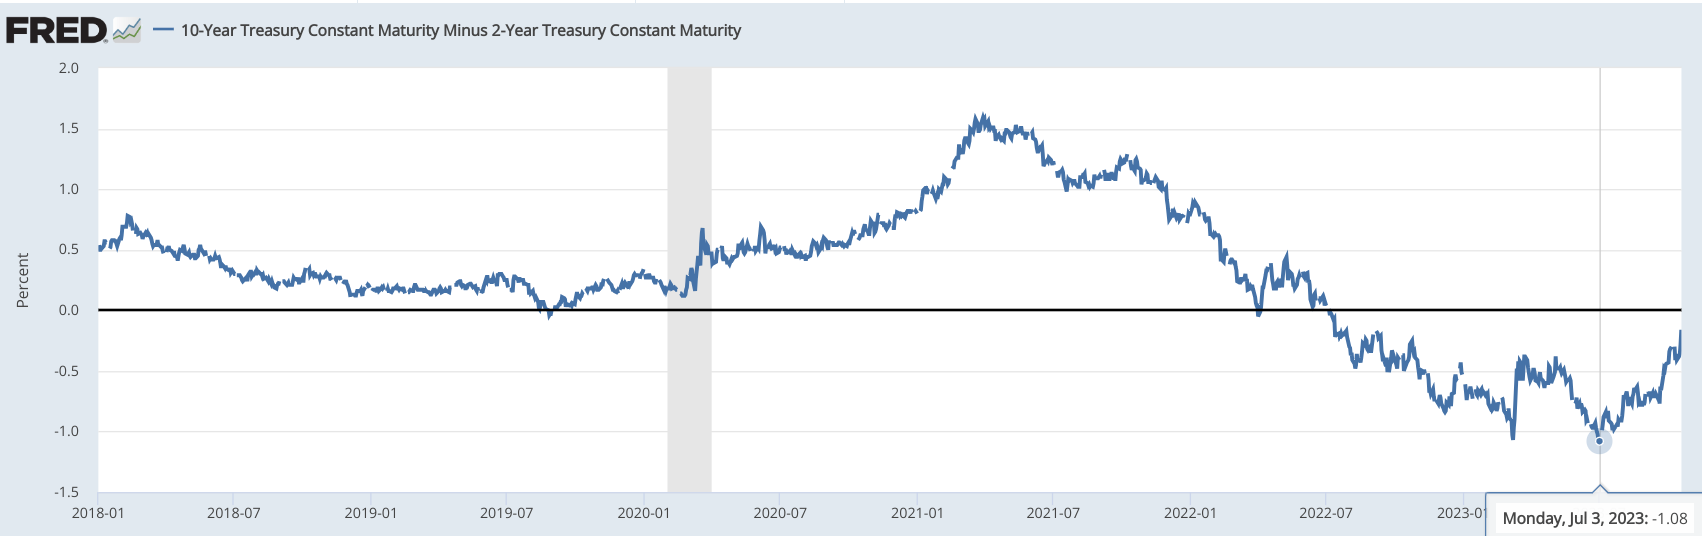
The key to watch is to know when it reaches the bottom and begins to rise up. This is the main point of this article. We can see the chart where it crossed down 0 points in July 2022 and touched the bottom in July 2023. Currently, it climbs up consistently toward the zero line.
Please notice that the gray zone or recession arrived a few months after the inverted yield curve back into the positive territory. Please use this chart to feel the coming troubles on the markets. If history repeats, the storm will arrive in the months ahead. It could intensify in Q1 2024.
Inflation, wars, and various problems could surface altogether.