stock chart today
Stock Chart Today: Downtrend Channel and Support Line (QQQ)
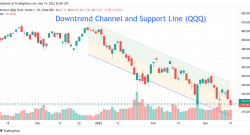
March 14, 2022, 4:07 pm EDT Downtrend Channel and Support Line (QQQ) Nasdaq has been in the consistent downtrend channel since the beginning of 2022 as shown in the Nasdaq-100 ETF (QQQ). Also, the key...
Stock Chart Today: Deteriorated Breadth Indicator
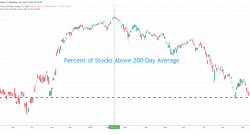
September 11, 2021, 7:49 pm EDT Deteriorated Breadth Indicator Although stock markets made a new record high earlier this week, breadth indicators have deteriorated consistently since February 2021. I...
Stock Chart Today: Rebound Wave
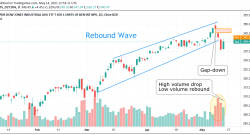
May 14, 2021, 8:54 am EDT Rebound Wave The stock market began its rebound wave after three red days. Here are two factors to check in the next few sessions to determine if this rebound will re-charge ...
Stock Chart Today: Nasdaq Gap Down and Lost 50 Day-Moving-Average Line
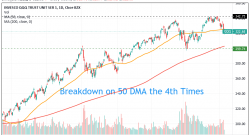
May 11, 2021, 10:38 am EDT Nasdaq Gap Down and Lost 50 Day-Moving-Average Line This is the 4th time the Nasdaq or QQQ (Nasdaq100 ETF) lost its 50 DMA. Also, it was the 4th time in a year. Compared to...
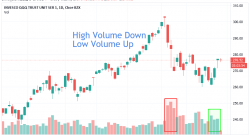
Stock Chart Today: High Volume Down, Low Volume Up
September 29, 2020, 12:57 pm EDT High Volume Down, Low Volume Up After a couple days of rebound, today is down about -150 points in DJIA. Nasdaq holds up better today about flat. Congress $2.2 stimulu...
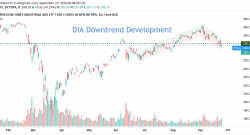
Stock Chart Today: Downtrend Development
September 24, 2020, 8:11 pm EDT Downtrend Development Dow Jones gave up a couple hundred points in intraday trading by ending +52 points as part of rebound effort in the middle of downtrend developmen...
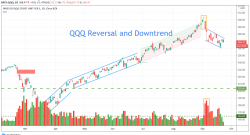
Stock Chart Today: Stay Downtrend Bias
September 23, 2020, 12:34 pm EDT Stay Downtrend Bias Downtrend is being developed after QQQ high volume reversal. Stay bearish bias.