September 11, 2021, 7:49 pm EDT
Deteriorated Breadth Indicator
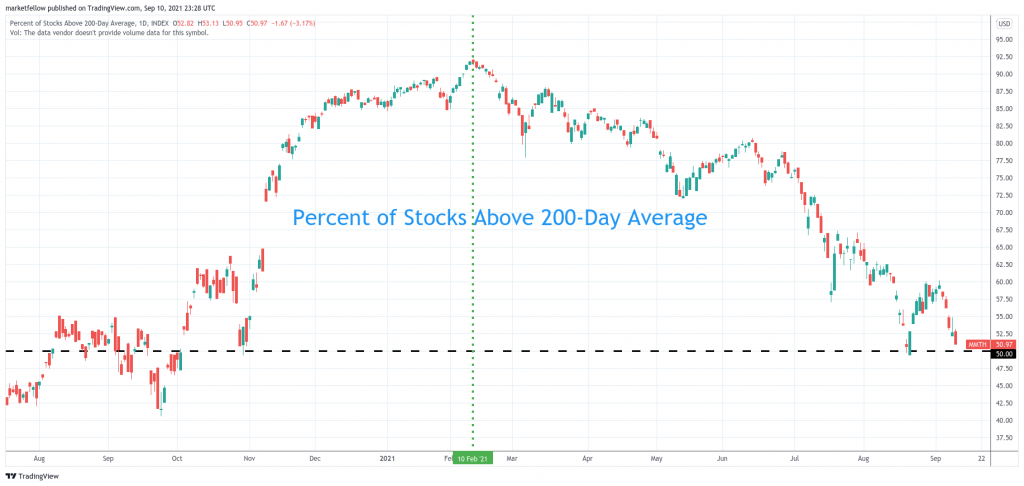
Although stock markets made a new record high earlier this week, breadth indicators have deteriorated consistently since February 2021. It means that percentage of individual stocks was much morse than the picture of the all-time high.
We will use Percentage of Stocks Number of Days Moving Average to illustrate our viewpoint. There are three popular moving average lines for references:
- MMTW: Percent of Stocks Above 20 Day Moving Average; short-term trend
- MMFI: Percent of Stocks Above 50 Day Moving Average; medium-term trend
- MMTH: Percent of Stocks Above 200 Day Moving Average; long-term trend
Using MMTH or 200-day moving average as an example we can see it top-out on February 10, 2021, at more than 90% level. But, it kept going down to about 50% for the past 7 months steadily. 20 and 50 DMA indicators behaved even worse to below 50% level. At the same time, all major indexes were still making numerous record highs in the past 7 months.
Indexes are weighted by the market capitalization of underlying stocks. Thus, mega-cap stocks like AMZN, AAPL, MSFT, GOOGL, FB have much influential power than their smaller peers in terms of index prices. Therefore, rosy pictures of the indexes do not reflect the chance of individual traders to make profits because chances to hit the targets are narrower or smaller.
Therefore, there should be no surprise to feel harder to make a winning trader in this environment unless you trade index ETF.
It is important to understand this technical perspective. Because it provides an early warning behind good-looking indexes. In other words, you will see the bubbles may be about to burst if those mega-caps are not able to decorate the indexes anymore.
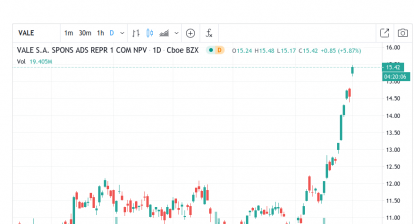
This is exactly what happened this week when Apple (AAPL) is down. -3% does not sound too bad but imagine only 50% of stocks were above their long-term reference (200 day-moving-average) compared to 90% in February.
In summary, it would be wise to have defensive strategies at this moment. Avoiding aggressive trading, trimming down weak holdings, raising cash levels, or getting in defensive stocks (utility, REIT, consumer staples) are some examples to prepare for a tough time when it comes. Pay attention to the performance of these mega stocks to determine whether the bubble is about to burst.