May 11, 2021, 10:38 am EDT
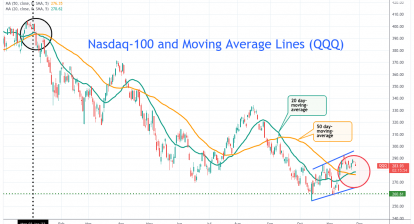
Nasdaq Gap Down and Lost 50 Day-Moving-Average Line
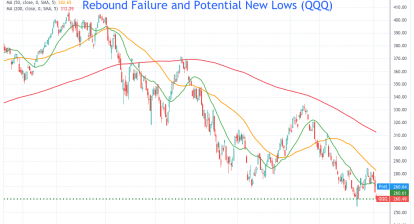
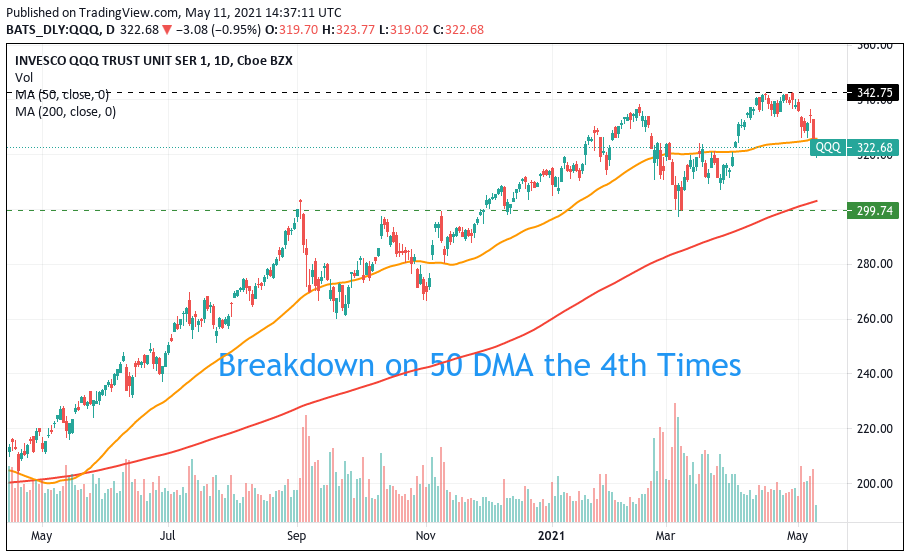
This is the 4th time the Nasdaq or QQQ (Nasdaq100 ETF) lost its 50 DMA. Also, it was the 4th time in a year.
Compared to Dow Jones or S&P500, which were on the record high yesterday, Nasdaq was the leader for the downtrend. As shown in the chart, Nasdaq was down for a couple of weeks already.
Therefore, if we follow the Nasdaq as the leading indicator for the stock markets trend, then we can expect a higher chance for the next target of 200 DMA. It will be the March low or Nasdaq 12438 (QQQ 300) for support or rebound.
Meantime, sell-off or downtrend could continue for the next couple of weeks.