June 30, 2020, 11:36 am EDT
Volume Tells All
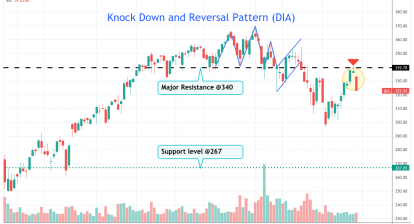
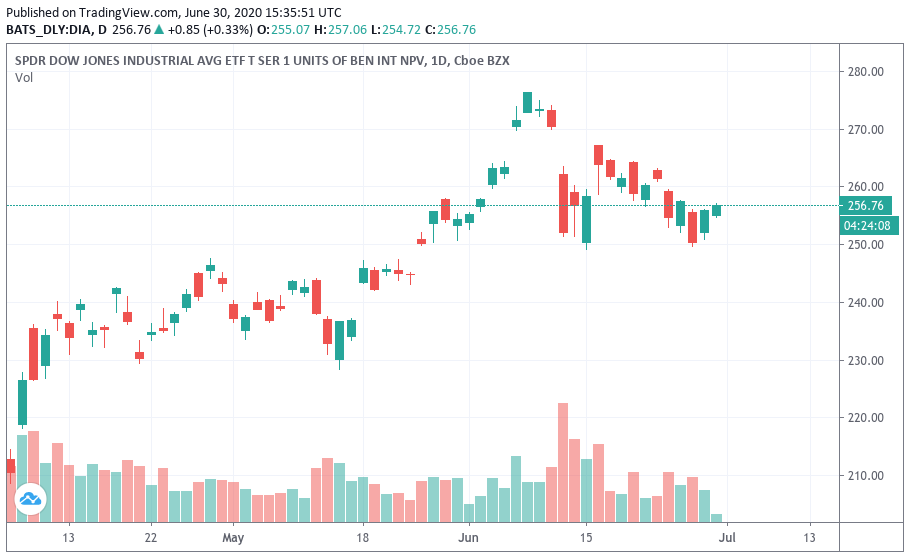
Dow kept rebounding with another 100+ in the opening. But it fades away quickly. It is simply a rebound after the 06/11 gap-down.
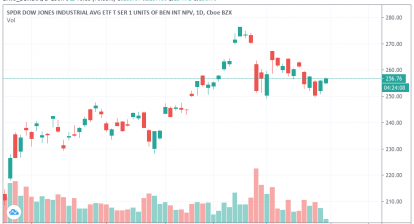
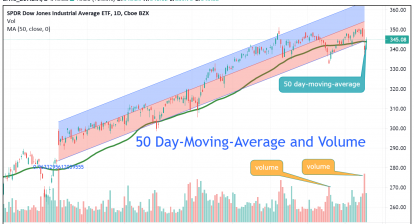
Using the DIA chart as an example, it reveals volume bars were higher on down days compared to up days. It means sellers were more aggressive than buyers. Although downside follow-through did not come yet, it could happen anytime. QQQ 240 is the key measurement level as we mentioned.