January 3, 2024, 10:44 am EST
Unwinding (DIA)
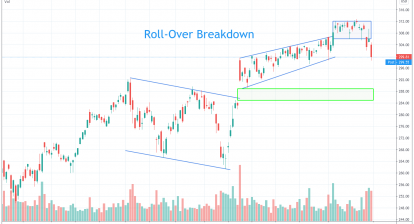
The stock markets are like a rubber band. It can be stretched and squeezed in such a way that is far from its normal shape. But, this process created tension that forms a reverse power. After reaching the turning point, it will unwind to its normal status.
We can witness this unwinding process occurring in today’s markets.
All major indexes made a super santa rally for nearly two months, November-December 2023. It accumulated about 17-20% gains during this period. It is a very unusual event in the history of the stock markets. The tension or called overbought reaches a point that needs to be reversed now.
We may ask where is the “Normal” level that a stock will shift around when the overbought or oversold conditions are resolved.
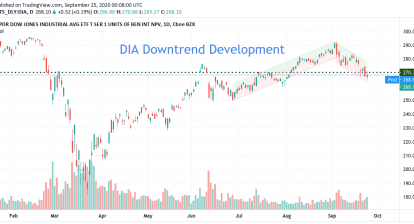
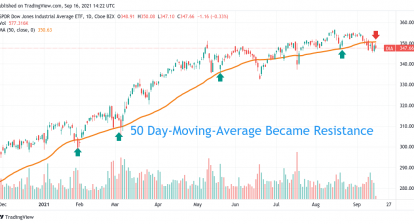
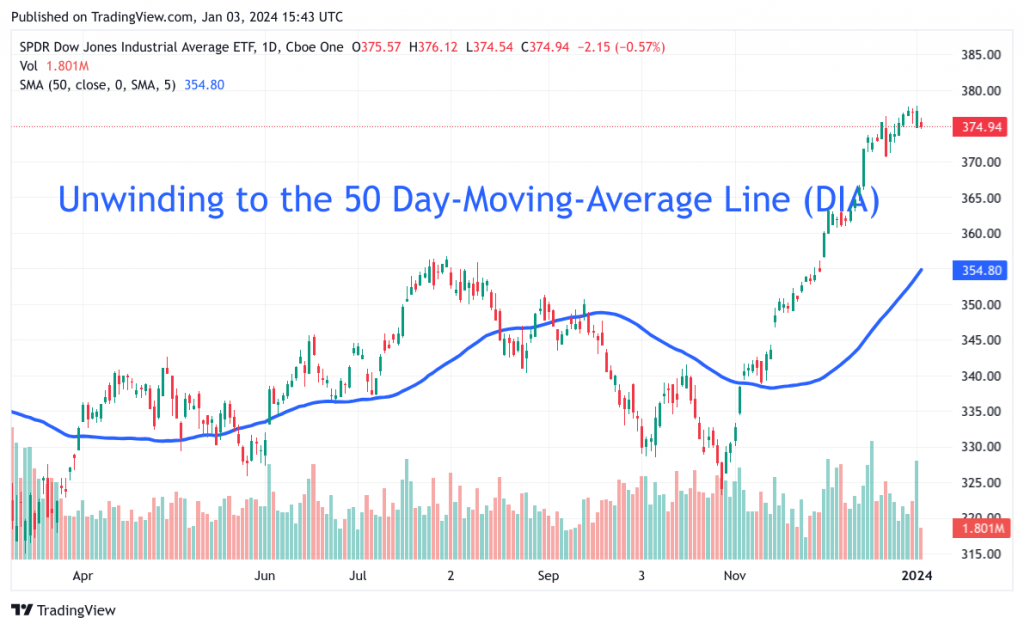
In our opinion, we consider the 50-day-moving-average (DMA) line as the neutralized level for reference. In this example of Dow Jones ETF (DIA), we can see DIA was around the 50 DMA most of the time in 2023 before November 2023. It took off the ground in November and never looked back until now.
We can use the 50 DMA as a guess-estimated pullback point for this unwinding process to finish. Of course, technical analysis is not a science. But, it offers us a reasonable forecast. Combining with other observations in the markets, we are better prepared to adjust our strategy for this nearly random market to get profits and minimize losses.