July 20, 2021, 9:04 pm EDT
Technical Analysis with Moving Average and Volume (DIA)
Nobody can give you a sure answer on what is going to happen for the stock market for tomorrow, next week, or the end-of-year performance. You can safely ignore any individual opinions or predictions because the stock market goes at its own pace.
However, there is still a way to make objective judgments or biases through chart analysis or technical analysis. Two useful ways are moving average line and volume pattern.
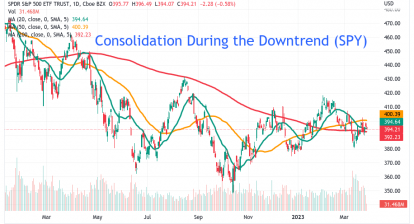
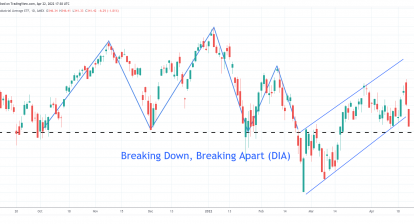
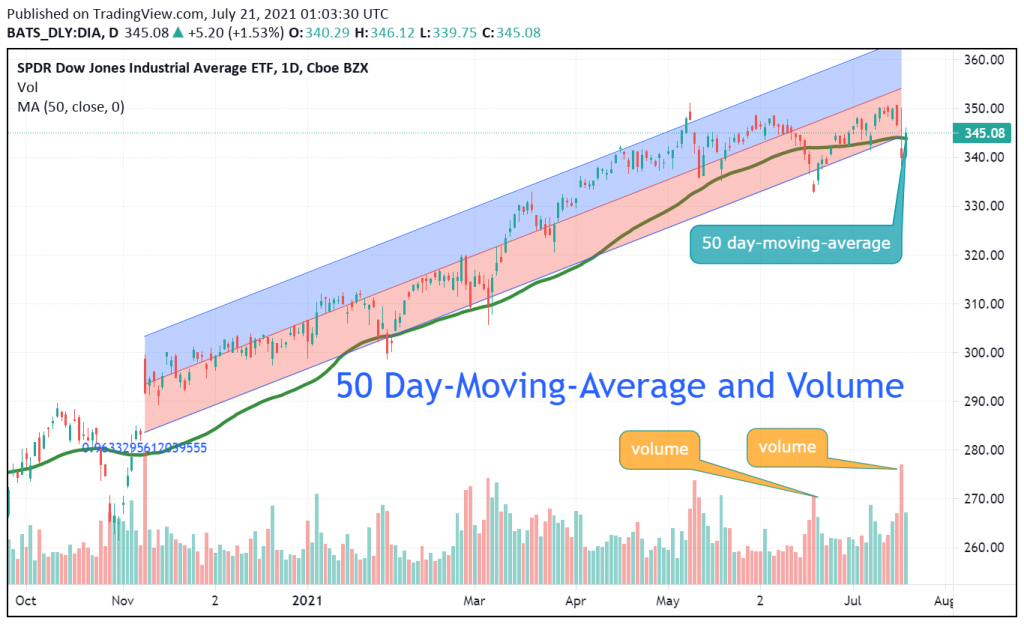
Moving average lines smooth out the line for the past given days. Usually, 20, 50, and 200 day-moving-average (DMA) are used for short, medium, and long-term trend analysis. These levels provide important sentiment to decide the strength of the underlying stock or market. Let’s use Dow Jones Index Average (ETF: DIA) to check out what happened.
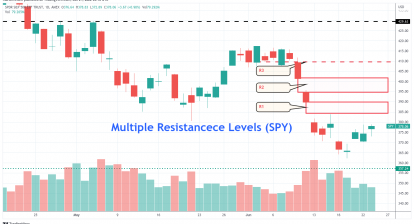
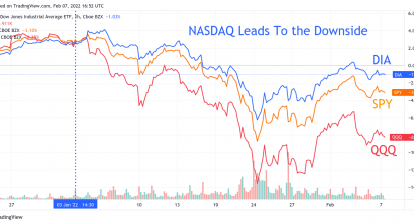
Dow Jones is similar to the S&P 500 with components of the largest companies in the US (30 and 500). Thus, they represent how the stock market performed very well. Yesterday was a major drop and pulled both DJIA and S&P just under their 50 DMA respectively. But, today they all climbed back and held above it. Please note that this is the 4th time since November 2020 that they dropped below their 50 DMA. All the past three times, they recovered almost immediately the next day or a week. So, this time we need to see if they can hold above 50 DMA either this week or next week. Especially, it becomes harder to rebound after the 4th or 5th time.
In addition, 50 DMA also serves as a key level for many institutional investors. If those players lose faith and decide not to buy in at 50 DMA, then the stock market may turn into a downtrend cycle.
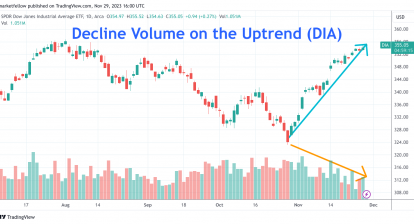
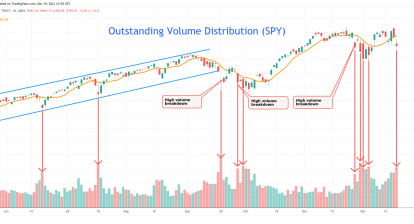
Volume is also another important indicator to measure the sentiment of big guys who buy and sell hundreds of thousands of stocks. Looking into the featured chart of DIA, it is easy to notice that they wanted to sell (or called distribution) rather than buy/hold (or called accumulation) stocks.
In conclusion, 700 down 600 up may confuse everyone on what would be the next action. But, by following the indicators like 50 DMA and volume pattern, we can see internal weakness for both DJIA and S&P500. We will watch 50 DMA closely as it will tell us the timing when the uptrend is over and the downtrend takes over.