March 10, 2021, 2:08 pm EST
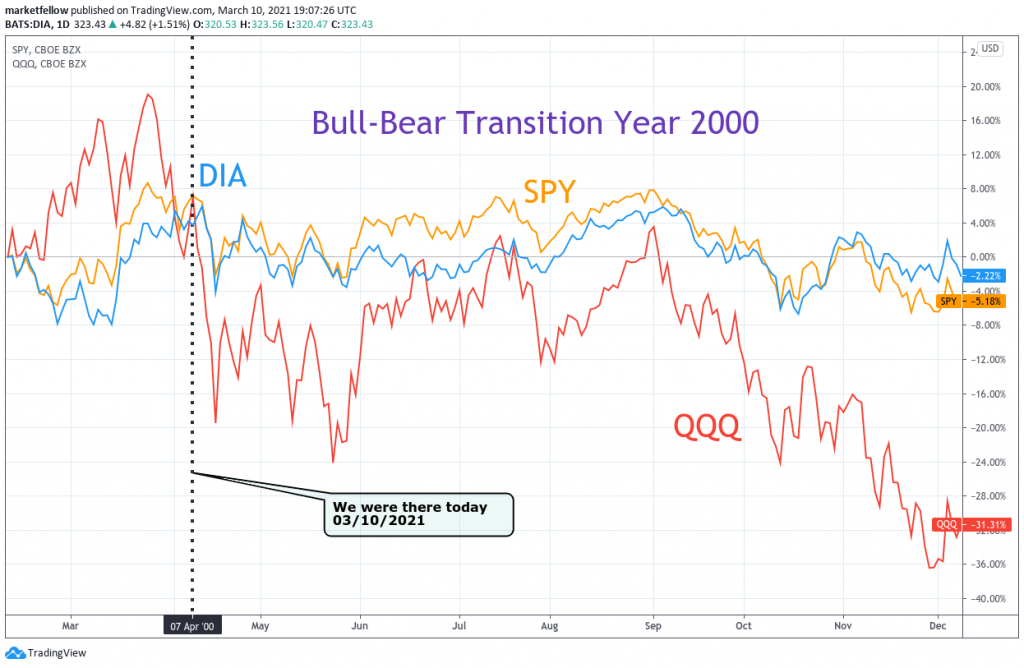
Bull-Bear Transition Year 2000
Nobody knows the future but everyone knows the history. If history can teach us some lessons, then it is important that we learn from it. Furthermore, the stock market bull-bear transition can map into today’s market from the charts. Here we use the year 2000 stock markets that happened twenty years ago to see its pattern, correlation, and timing apply to today’s market.
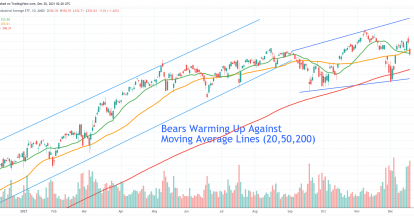
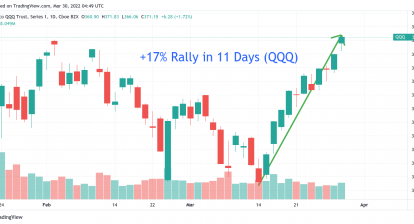
- Nasdaq (Nasdaq-100 ETF: QQQ) was a strong leader prior to topping out on March 9, 2000. This is very similar to today’s market with about 100% gains from February 2020 to February 2021
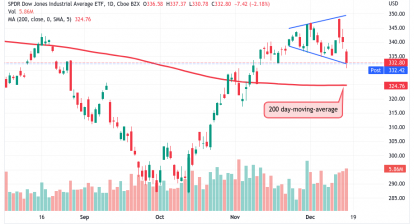
- Dow (ETF: DIA) and S&P (ETF: SPY) lagged behind Nasdaq during the Nasdaq rally
- When Nasdaq reversed from the top to its first stage, Dow and S&P were still near the record-high area.
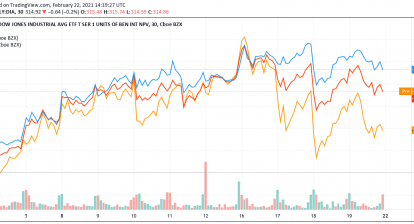
- Three-day rebound (04/05/2000-04/07/2000), which mapped to today’s condition, was to prepare the next sell-off wave
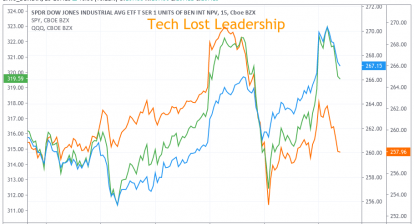
- Then, it was another 5-day strong selling (04/10/2000-04/14/2000). Notice Dow and S&P performed well during that time. It made sense to see money rotation from red-hot technology or bubble to safer stocks like financial, industrial, energy, material. Does it sound similar when you compare Tesla (TSLA) with JP-Morgan (JPM) today?
- The rest story is straightforward to see bull gave its position to bears in the next 12-15 months that Nasdaq lost -80% and Dow was down -40%.