December 19, 2021, 9:20 pm EST
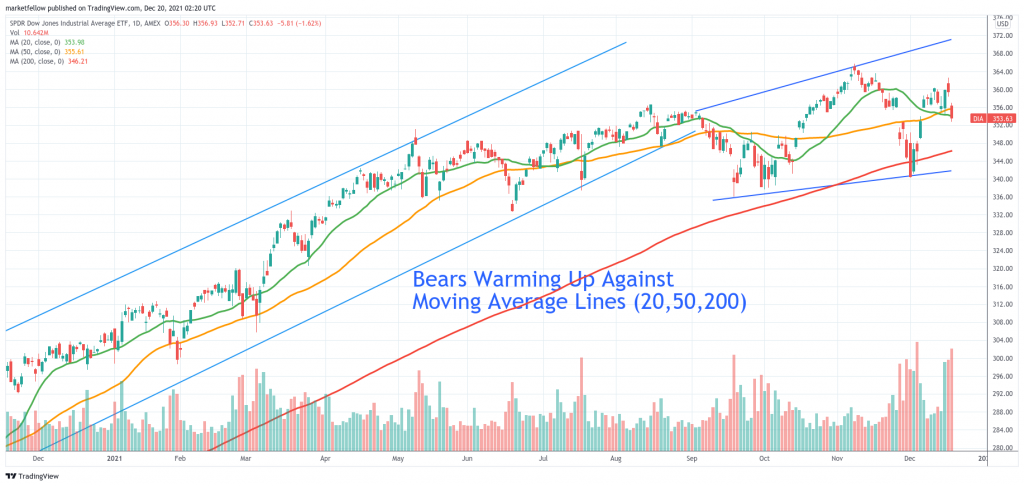
Bears Warming Up Against Moving Average Lines (DIA)
The conventional definition of a bear market is the drop of -20% from the top. Here is another way to see the progress of bears using moving average lines. After all, the bear market does not arrive instantly. It takes time for its full development. But, it would be helpful if we can visualize them along the way. Technically, we can use three moving average lines: 20, 50, and 200 to measure the strength. They represent the bias of short (20), medium (50), and long (200) trends.
Last Friday (12/16) drop quickly crossed out the short-term line (20) and touched the medium trend line (50) as shown on the Dow Jones ETF (DIA). Any gap-down by tomorrow (12/20) would terminate the medium and threaten the long-term (200) lines. At this moment, it seems like coming.
Therefore, we can definitely feel the warming up of bears when all three lines are broken. Please be alert if it happens because it would be a signal for us to prepare for bears before DJIA loses -20% of its values.