March 25, 2021, 10:59 am EDT
Goodbye to Support Lines
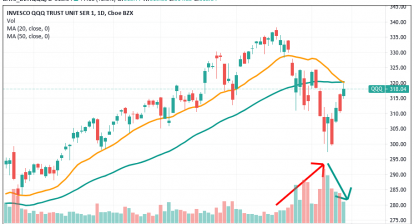
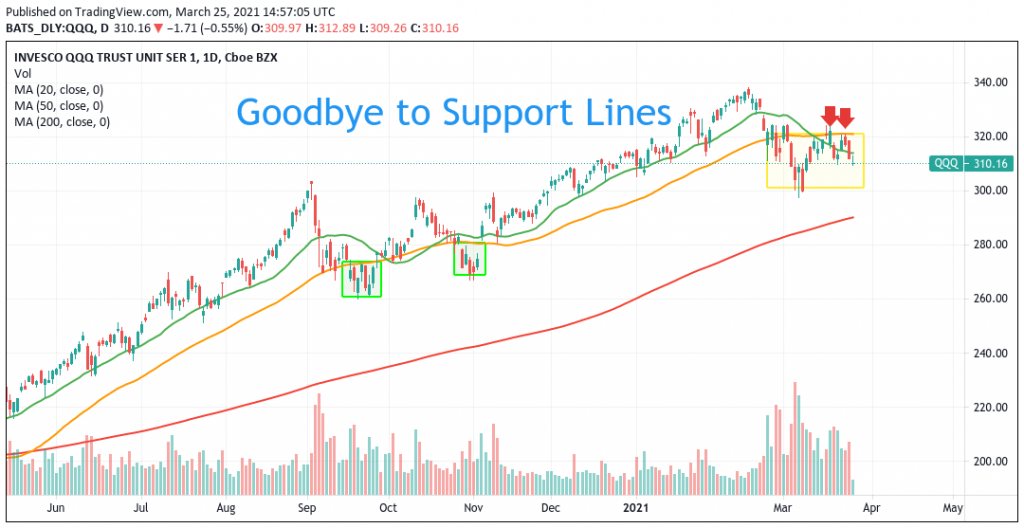
It is time to say goodbye to support lines. Technically, support lines represent a key level of defense defined by certain time frames. In the given chart of Nasdaq-100 QQQ, we use short, medium, and long term lines (20,50,200 day-moving-average or DMA) to show how QQQ responds to these levels.
Nasdaq has been strong for the past 12 months to reach more than +100% gains (QQQ 170-340). Its strength can be identified by its ability to stay above all lines most of the time.
But, the good time may be near the end recently as 20 and 50 DMA lines are gone. Specifically, 50 DMA only broke twice last September and November then quickly recovered. This time is not the same when QQQ broke through 50 DMA in late February it cannot recover. Furthermore, 50 DMA became the resistance twice to prevent QQQ from getting back.
Meantime, QQQ is still above 200 DMA but market conditions may change completely. It is important to make the necessary adjustment to the portfolio settings to avoid technology and shift to defensive types of investment like utility, consumer staples (food), and REIT.