October 6, 2021, 1:31 pm EDT
Uptrend Over. Downtrend?
Dow Jones made one of the strongest rallies in 120 years of history producing about +100% return between March 2020 and September 2021 (18 months, ETF: DIA from 190 to 380). But, the uptrend is over by early September. Then, the question is what is the next? Resume rally, sideway, or downtrend?
Instead of guessing, it would be straightforward to use the technical analysis to get the answer.
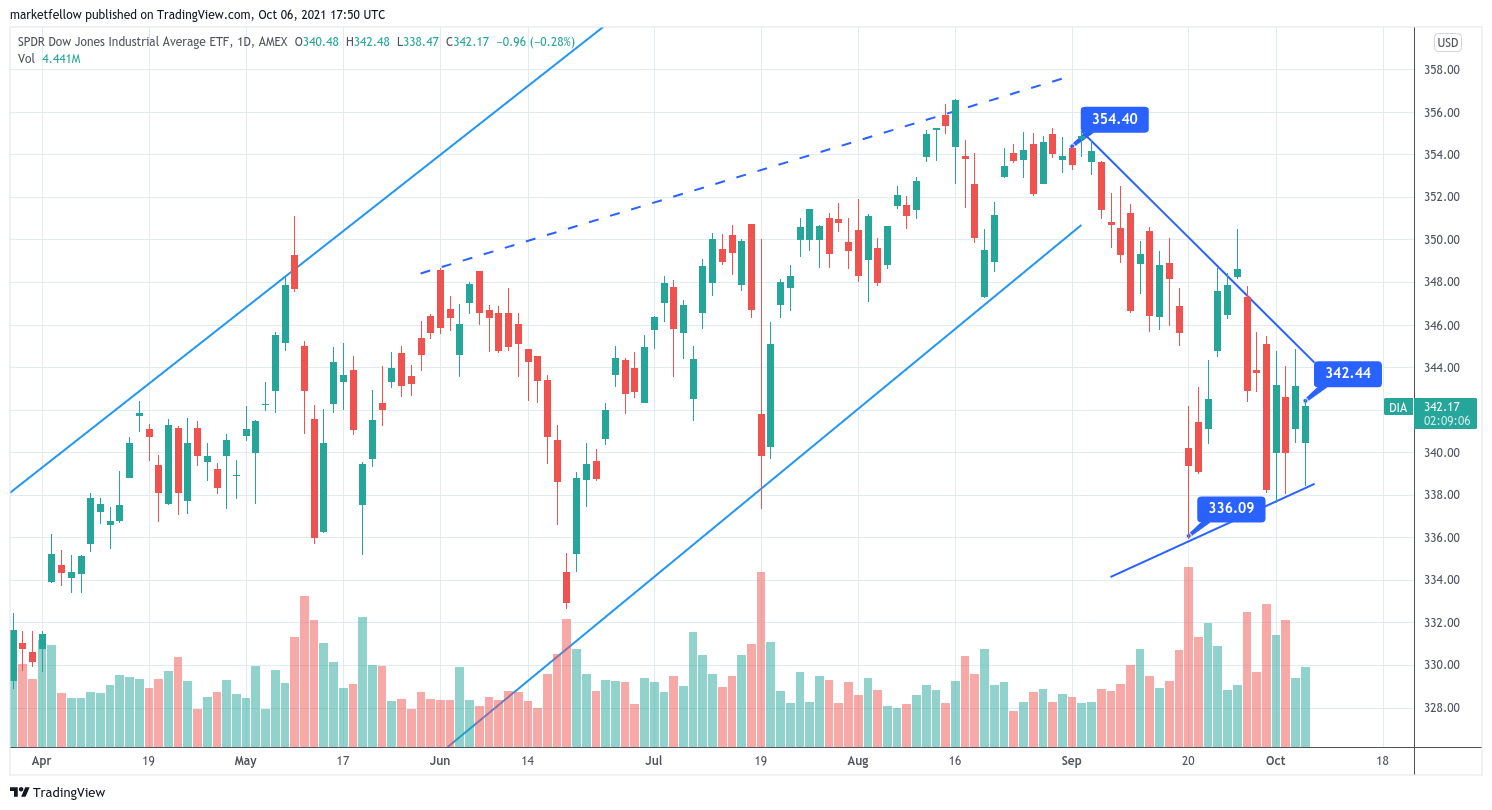
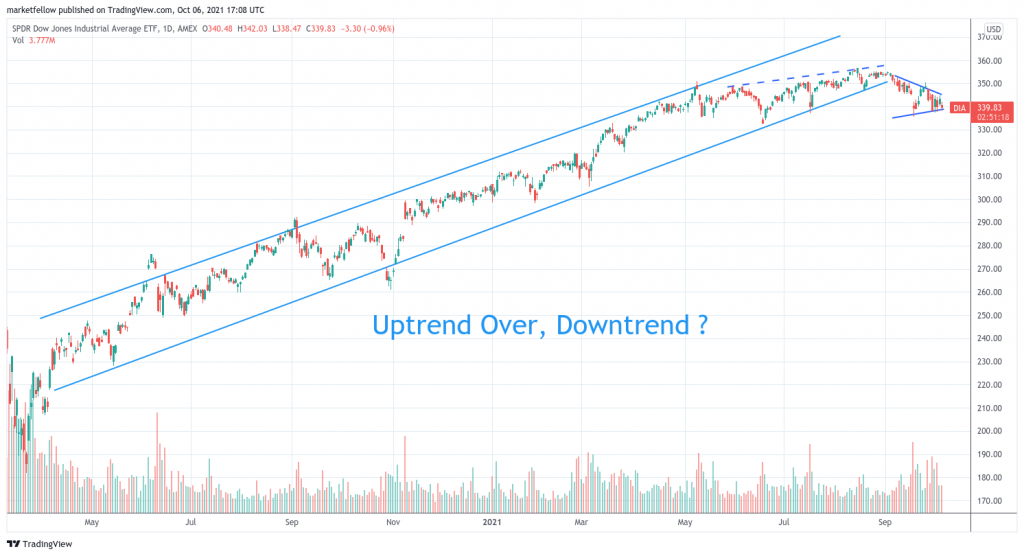
As shown in the featured chart on Dow Jones ETF (DIA), we can see the uptrend was interrupted in early September. Then it made a convergence pattern with up and down actions till today. The relative low is 336 and the relative high is 354. The convergence is located at 342. These three numbers are important references for us to determine its next direction.
- First of all, the convergence pattern suggests that certain decisions would be made at the end of the pattern. Thus, we shall see the direction to deviate from 342 or the neutral point soon.
- Second, the upper and lower boundaries gauge the initial actions when the power is just about to release. Thus, pay attention when it happens because it provides the precious timing for us to make decisions accordingly.
- Third, 354 and 336 are the final verdicts for either the bullish rally or bearish breakdown.
- Finally, anything in between means undecided.
One more note is to monitor the volume behavior. When the volume begins to expand, then it is to remind us to put more weight on the actions, either up or down.
In summary, the Dow Jones index hang in there after the initial breakdown. Currently, it is going through the consolidation process by the convergence pattern. The short-term and medium trend biases are both down. The upper and lower key levels are 354 and 336. Upper and lower boundaries are the early signals for major actions. The neutral point is at 342. Using these data, we could easily interpret what is next without asking others for their opinions.

