March 8, 2022, 6:43 pm EST
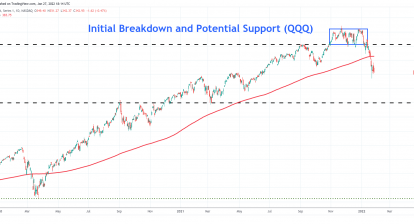
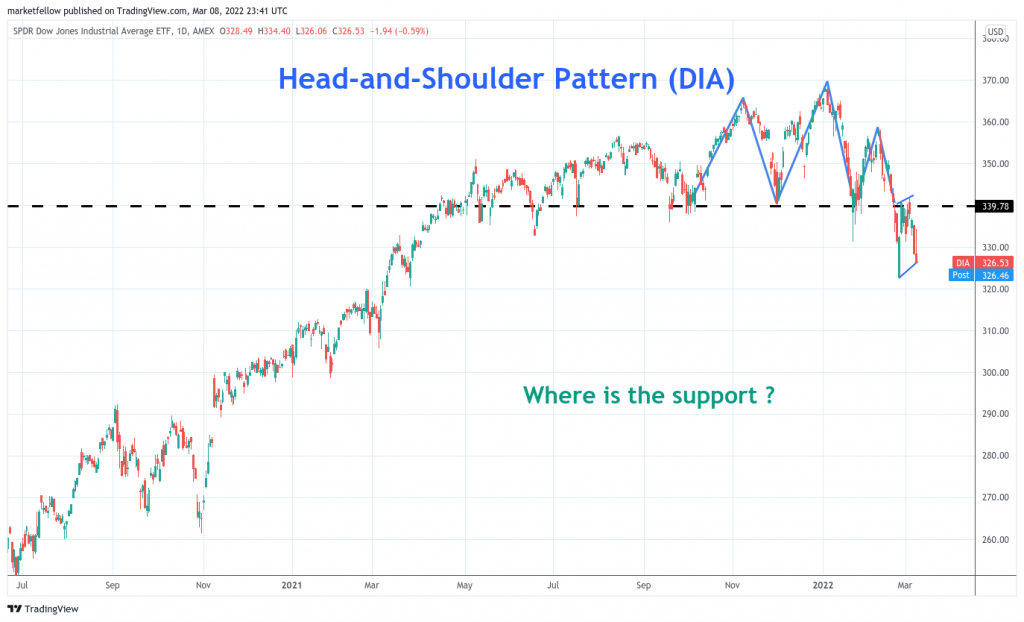
Where Is the Support?
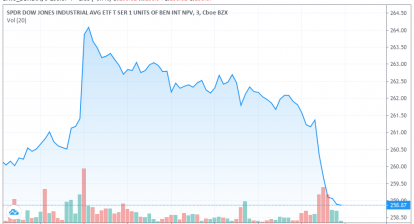
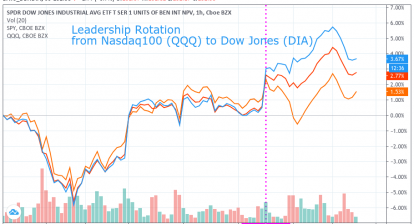
The stock market suffered another bloodshed day with -185 points down in the Dow Jones index at close. It was more than -800 points down from the intra-day high so it finished poorly. This volatility is driven by the Russia-Ukraine war the consequence of various economic sanctions. All actions pushed crude oil price to the $120-130 range which was more than double the price at the beginning of 2021. Alternative and renewable energy-related stocks climbed higher in response. We will cover more in the next articles.
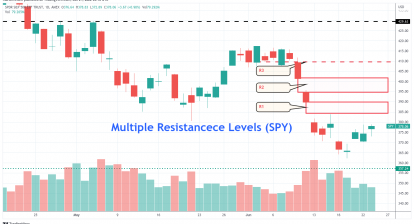
The question we would like to ask at this junction is “Where is the Support ?” if Dow Jones goes down again in the next few days. As shown in the featured chart of Dow Jones ETF (DIA), there is no obvious support level available from a technical analysis point of view. It means that breaking the low made by 02/24 could produce a long downtrend. Furthermore, it could generate sell-off with high price and volume actions. Of course, if the war condition gets improved, there could be a strong rebound also.
It is important for us to stay on high alert in order to prepare for the coming actions. We are bearish about the development of the war and market actions.