December 19, 2021, 3:39 pm EST
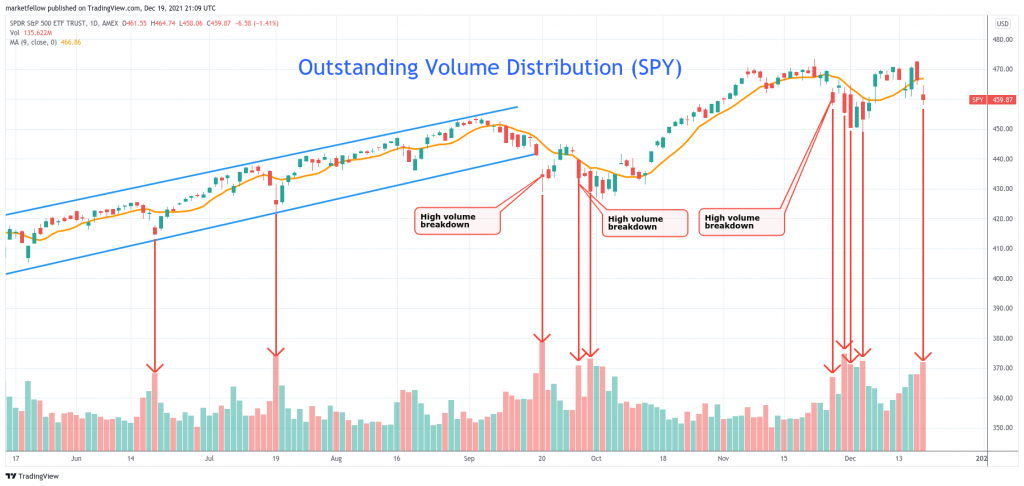
Oustanding Volume Distribution (SPY)
Outstanding volume means abnormal or unusually high volume activity on a stock or index for a certain day. It indicates lots of tradings are processed through the market order. When buyers are more aggressive, the stock is up. Or, motivated sellers could drive the price down when they come to make the ‘sell’ market order.
When the distribution is visible through multiple high-volume selling days, it indicates that markets turn to a bearish mind by institutional investors. It is like a movie theater getting fire, large crowd wants to get out of the exit doors as soon as possible. Initially, only a small group of people notice the potential trouble of smoking in the room so they run out first. Gradually, more people feel uneasy about the environment. Eventually, everyone wants to run away to save their life.
Please take look at the featured chart of S&P 500 ETF (SPY) where you can see the marks of distribution. High volume distribution occurred many times since June 2021. Initially, there were only two times in June-July, then it expanded to three times in September. Recently, we counted five days of high volume sell-off in November-December.
More importantly, they all occurred around the 50 DMA line as shown in the orange color. It illustrated the fear of the S&P 500 at the key level for intermediate trends. It spells out troubles.
S&P is still at a new record high two trading sessions ago so it is still bullish from the price point. However, if we look at the annotations on distributions, we would sense the inner weakness of the S&P 500.
In summary, high volume distribution serves the purpose of reminding coming beamish actions. Market participants should keep in mind that danger is near.