December 14, 2020, 7:27 pm EST
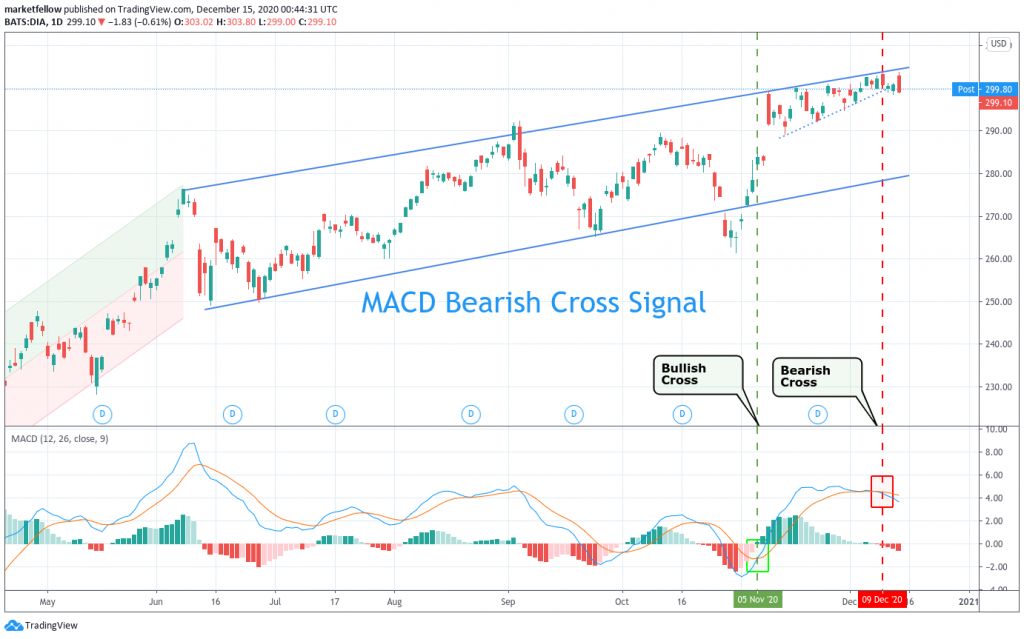
MACD Bearish Cross Signal
There are hundreds of technical indicators for technical (or chart) analysis for the stock markets. Moving average convergence divergence (MACD) is a trend-following momentum indicator that shows the relationship between two moving averages of a security’s price. MACD is very useful to give you a clear crossing signal for a trend development, either crossing up (bullish) or crossing down (bearish) bias.
If you are a trend follower type of traders or investors like us with trading time frames of few weeks or few months, MACD could be a indicator to use.
The featured chart shows an example that uses DJIA ETF or DIA to illustrate how to use MACD.
From this example we can see 11/05 is the day to enter a long position on DIA because of MACD crossing up. Similarly, 12/09 is the day to switch to bearish bias according to MACD crossing down signal.
Please note that indicators are not a magic wand or crystal ball to tell you what will happen in the future. It simply tells you what happened in the past and now in terms of its predefined formula for probability of its future development. There is absolutely no guarantee of its accuracy and timing. However, it could be a useful weapon that gives you another objective criteria to prepare for potential development combined with other analysis like patterns, trends, or gaps.
In summary, MACD gave a bearish signal so it may be reasonable to scale back a bit or stay defensive for portfolio management.