January 13, 2022, 4:24 pm EST
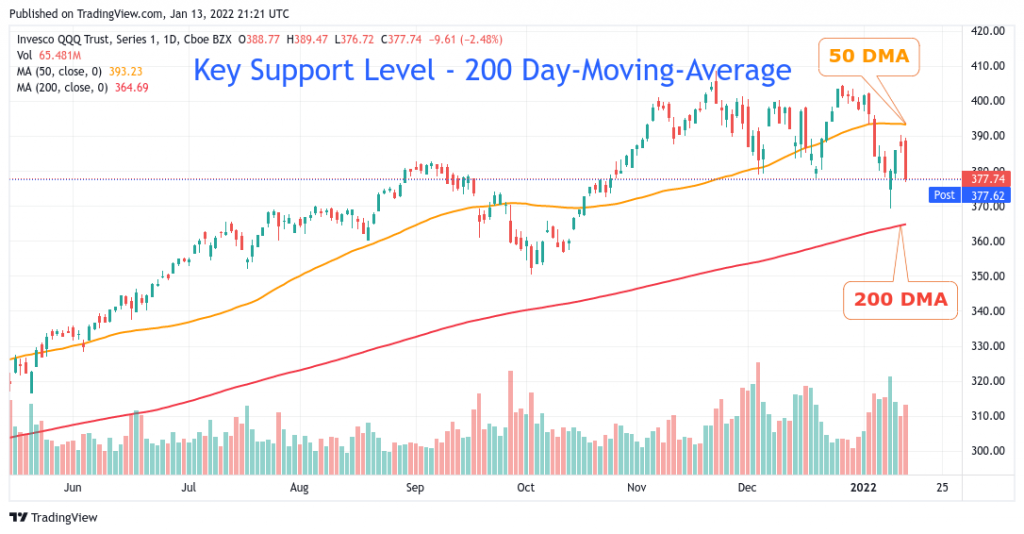
Key Support Level
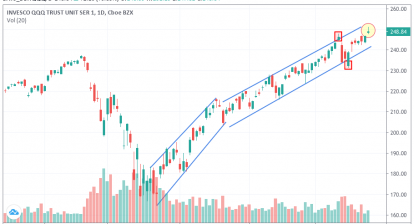
We had issued multiple articles recently that mentioned the trouble of the technology sector. For example, on 01/05/2022 we wrote The Coming Breakdown of the Technology. Today is another major warning against the technology stocks as we can see from either Nasdaq or Nasdaq-100 ETF (QQQ). We would like to point out the reference key support level, 200 Day-Moving-Average or DMA to watch.
Please see the chart shown in the featured chart of QQQ with annotations of both 50 and 200 DMA. 01/05/2022 was the major breakdown day for its medium trend line, 50 DMA. Then, it was a rebound wave until today that rebound seemed to be exhausted.
Therefore, the key support level will be its 200 DMA line in order for QQQ to claim bullish bias. There are still some distances but it could change quickly. We consider this is the very critical reference level to determine whether QQQ is still in a good shape. In theory, many institutional investors also watch this line closely.
Nasdaq is even closer to its 200 DMA line so both we worthy of attention. Breakdown of AMZN, AAPL, MSFT, FB, TSLA is easily visible to see these trillion-dollar market cap giants suffered badly from their valuation and coming rate hikes.
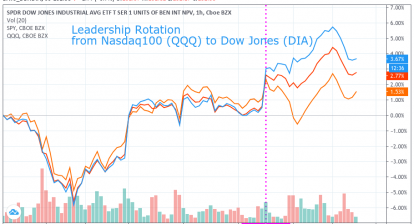
In summary, Nasdaq is a leading indicator that leads the way up or down. If Nasdaq is in trouble or breaking its 200 DMA line, it would be better for market participants to prepare for the tough time.