February 23, 2022, 1:09 pm EST
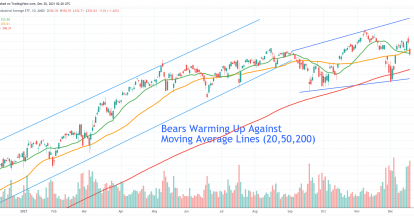
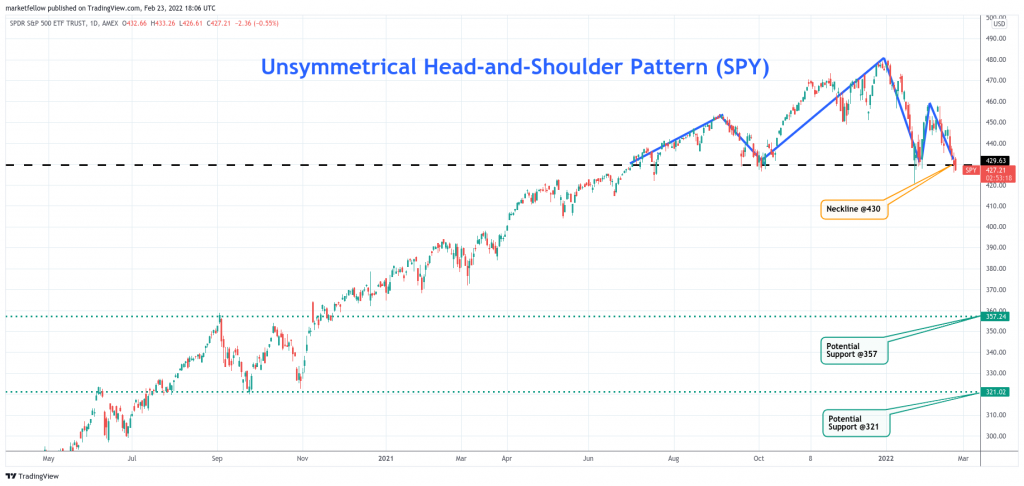
Unsymmetrical Head-and-Shoulder Pattern (SPY)
Recently, there is much news about Russia’s invasion of Ukraine. It may create more confusion when dealing with the stock markets. But, there is a quick and easy way to understand what the market is thinking. It is through technical analysis or chart analysis. Here we have a rare mega (more than 6-months) pattern of unsymmetrical head-and-shoulder pattern based on S&P 500 ETF (SPY).
It provides an important answer to our question on what the market status is.
- This unsymmetrical head-and-shoulder pattern (SPY) is harder to identify because its shape is asymmetrical shapes
- Also, it took 8 months to complete (July 2021-Feb 2022) so it did not reveal in smaller timeframes
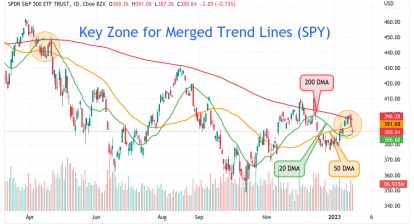
- Most importantly, SPY comes to a very critical level @430 which is its neckline or final support.
- If it breaks below 430, there is no support until the 321-357 area.
- It could mean a sharp sell-off when breaking down 430.
Falling below 430 as SPY doing now would be very bearish in our opinion. Not only head-and-shoulder would create strong selling momentum, but the neckline at 430 will change from support to resistance. Therefore, we consider this is very bearish signal regardless of the progress of Russia-Ukraine or other topics in the market.