December 6, 2022, 8:32 pm EST
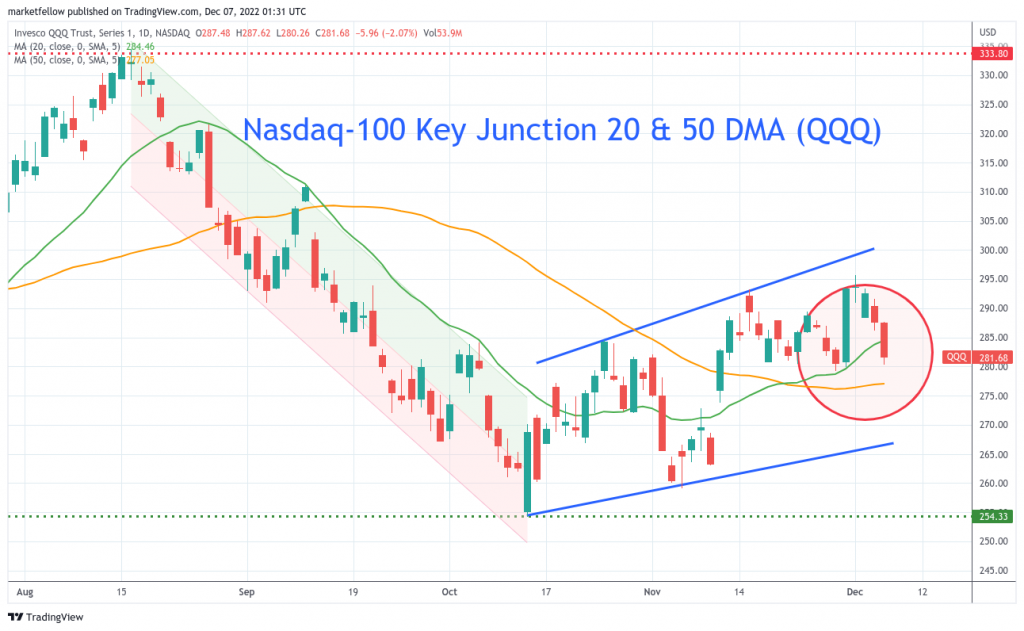
Nasdaq Key Junction
Two days of bloodshed sell-off hurt Nasdaq significantly. Especially, Nasdaq performed much worse than its peers Dow Jones and S&P 500 by a wide margin: DJIA -1%, S&P -1.4%, Nasdaq -2%.
None of the mega technology is able to hold: META -7%, AMZN -3%, NVDA -4%, MSFT -2%, AAPL -2%.
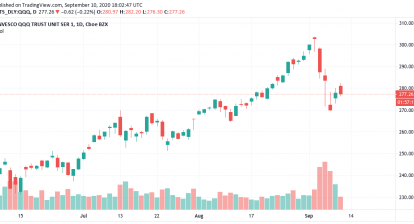
Thus, looking at the chart of Nasdaq-100 (QQQ) that we can clearly see Nasdaq comes to an important key junction technically. It is the red circle region where 20 and 50-day-moving-average lines merged.
Losing 284 today (20 DMA) and approaching 276 soon (50 DMA) raises concerns about the outcome if 276 is broken. There is not much support below except 260 and 254 the lows of November and October. It means that a sell-off could be triggered if it happens.
Therefore, it is worthy of attention in the next few days for the possibility of a major breakdown and selling waves by watching this key junction.