March 28, 2023, 2:07 pm EDT
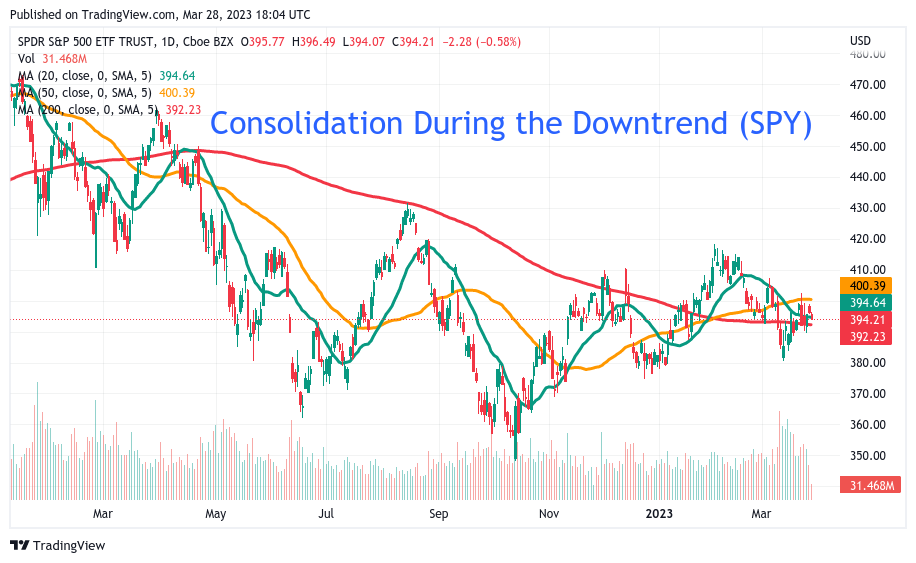
Consolidation During the Downtrend (SPY)
2023 Q1 (January to March) is going to finish in a few days this week. What is the status and bias of the stock market if someone asks you this question?
One of the answer could be “Consolidation During the Downtrend” using technical analysis point of view as show for S&P 500 ETF (SPY)
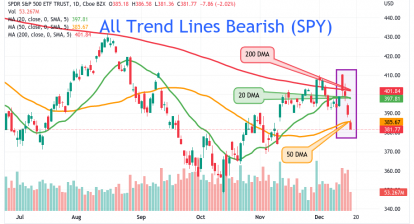
SPY topped out at the beginning of 2022. Then it was a consistent downtrend verified by undercutting all trend lines (20-green, 50-orange, 200-red) after April 2022 which was about a year ago.
This year 2023 SPY oscillated up and down between these trend lines. Thus, it is in a consolidation phase where bulls and bears are fighting hard without direction. However, when we zoom out of a 1-year or 1.5-year timeframe, we can easily see the downtrend action.
Therefore, it should set our bias clearly that a more cautious mind is needed for the coming quarter Q2. When these trend lines are broken again to the downside, it would be a signal that the downtrend is resumed again. Of course, the other upside could also happen. But, the chart suggests us to gear toward more bearish bias than bullish bias.