September 14, 2023, 12:06 pm EDT
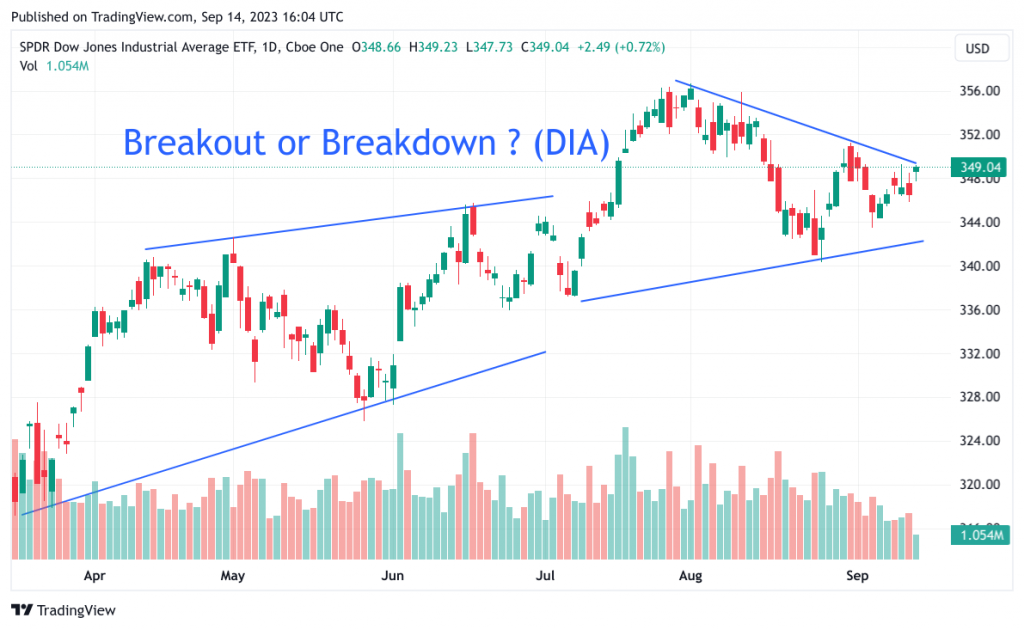
Breakout or Breakdown ? (DIA)
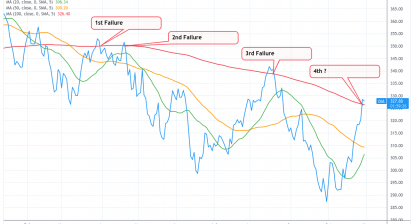
When the convergence pattern is getting closer to the late stage, it is important to pay attention to its next move.
This is the pattern shown in the featured chart of Dow Jones ETF (DIA). We can see DIA has made a convergence pattern since early July. After 2.5 months of couples of up-and-down cycle, the upper and lower boundaries are made by connecting the dots of highs and lows.
These two lines are helpful to give us a sense of its coming direction. Breaking out to the upper boundary means a potential breakdown. Otherwise, it could start a breakdown when the lower boundary is broken.
Based on this observation, the recent movement deserves attention. For example, today’s move touched the upper boundary that forms a breakout position.
It would be the first moment to initiate a long position on emerging stocks. Using this level as the protective sell-stop level if the breakout fails to continue. By doing so it should be able to catch a potential rally with limited risk involved.