October 5, 2022, 5:16 pm EDT
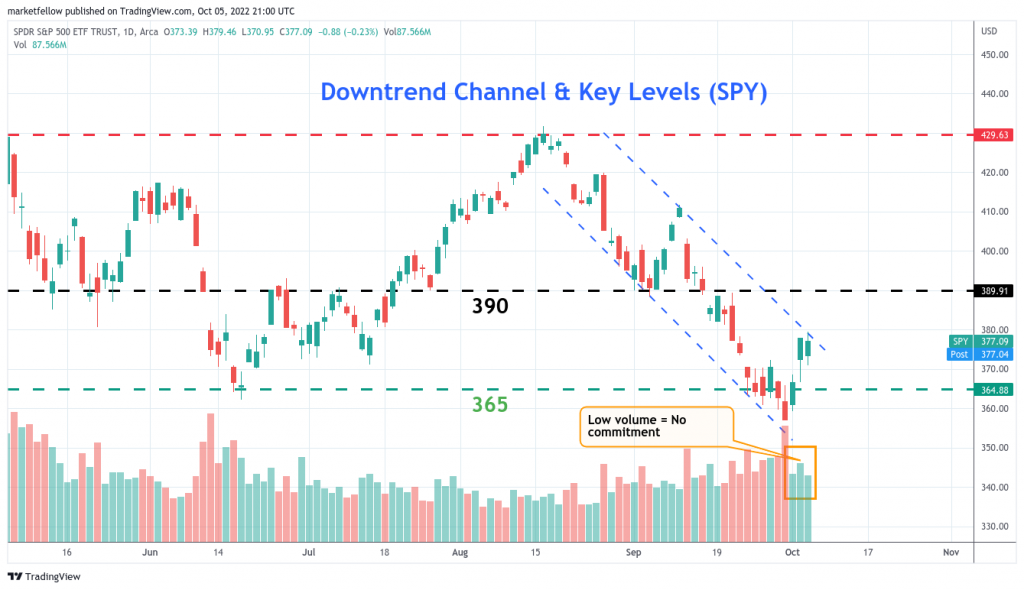
Downtrend Channel & Key Levels (SPY)
Technical analysis is helpful when you see the pattern and key levels. By recognizing those facts from the chart, a market participant can make a reasonable assessment of the market itself. Let’s use S&P 500 ETF (SPY) as an example.
First, we can see clearly that a downtrend channel is visible using mid-August and end-of-September as peak and bottom. Currently, we can see a two-day rebound (10/03, 10/04) and near-stalled action today (10/05). It is essential to note the volume on these three days was in the low range. Low volume means a lack of commitment to this rebound wave.
Second, if we draw a channel pattern, we can see today’s level could mark at the upper boundary. Therefore, further up days indicate a follow-through on the rebound which shows more upside power.
The third, more important level to watch is 390 where bulls reclaim most of their power if it happens. Currently, we consider 390 to serve as resistance.
Lastly, if SPY is unable to climb higher, then we downtrend would continue as the pattern suggested. Another key level 365 will come into the picture which is the key support level. Breaking this level means a new low or extension of the downtrend.