Charts
Chart pattern, indicators, drawing, etc
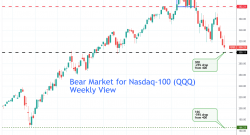
Stock Chart: Bear Market View for Nasdaq-100 (QQQ) Weekly View
May 8, 2022, 8:35 pm EDT Bear Market View for Nasdaq-100 (QQQ) Weekly View As mentioned in our previous two articles for Nasdaq-100 (QQQ) technical analysis we quoted two levels of downside support: 3...
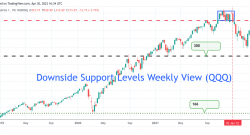
Stock Chart: Downside Support Levels Weekly View (QQQ)
April 30, 2022, 11:53 am EDT Downside Support Levels Weekly View (QQQ) Many people want to know where is the next support when Nasdaq or Nasdaq-100 (QQQ) made a fresh 52-week low yesterday. We will pu...
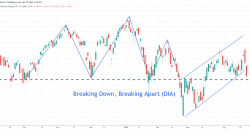
Stock Charts: Breaking Down, Breaking Apart (DIA)
April 22, 2022, 1:46 pm EDT Breaking Down, Breaking Apart (DIA) “Breaking down and breaking apart”. This is the message from Dow Jones Index (DIA) as shown. The bears are coming as we mentioned many t...
Stock Charts: Breakdown Warning for the Technology Stocks
April 21, 2022, 2:29 pm EDT Breakdown Warning for the Technology Stocks The stock market gives us a breakdown warning for the technology stocks. As shown in the Nasdaq-100 ETF (QQQ), 337 level is bein...
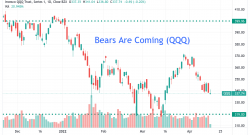
Stock Charts: Bears Are Coming (QQQ)
April 18, 2022, 12:06 pm EDT Bears Are Coming (QQQ) Definition of a bear market by widely accepted definition is -20% down from the recent high. Using this formula, we can see Nasdaq-100 (QQQ) could b...
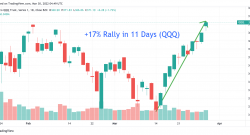
Stock Charts: +17% Rally in 11 Days (QQQ)
March 30, 2022, 12:51 am EDT +17% Rally in 11 Days (QQQ) It is unusual to see +17% gains in 11 days for a major index like Nasdaq-100 (QQQ). Optimistic expectations for the Russia-Ukraine talk could b...
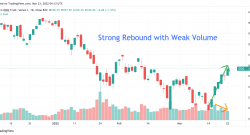
Strong Rebound with Weak Volume (QQQ)
March 23, 2022, 12:14 am EDT Strong Rebound with Weak Volume (QQQ) It was a strong rebound rally for the past 6 days. Nasdaq or Nasdaq 100 made nearly +12% gains which usually takes a year to accompli...
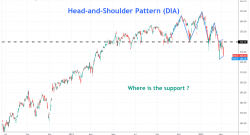
Stock Charts: Where Is the Support?
March 8, 2022, 6:43 pm EST Where Is the Support? The stock market suffered another bloodshed day with -185 points down in the Dow Jones index at close. It was more than -800 points down from the intra...
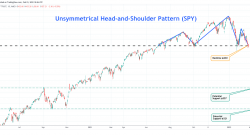
Stock Chart: Unsymmetrical Head-and-Shoulder Pattern (SPY)
February 23, 2022, 1:09 pm EST Unsymmetrical Head-and-Shoulder Pattern (SPY) Recently, there is much news about Russia’s invasion of Ukraine. It may create more confusion when dealing with the s...

