Charts
Chart pattern, indicators, drawing, etc
Stock Chart: Head-and-Shoulders Pattern (DIA)
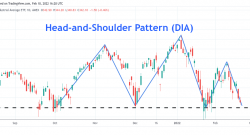
February 18, 2022, 11:30 am EST Head-and-Shoulders Pattern (DIA) The head-and-shoulders pattern is probably the most famous pattern for topping out based on technical analysis on the stock charts. Aft...
Stock Chart: Breakdown Follow-Through (QQQ)
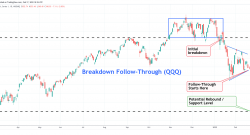
February 17, 2022, 2:17 pm EST Breakdown Follow-Through (QQQ) Technology-focus index Nasdaq or Nasdaq-100 ( QQQ ) has been in trouble in 2022. The initial breakdown at 382 was fatal and a warning for ...
Stock Charts: Squeezed Between Short and Long Term Lines (SPY)
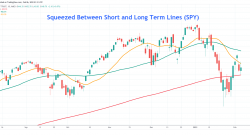
February 5, 2022, 8:08 pm EST Squeezed Between Short and Long Term Lines (SPY) The past 1-2 week was full of wild actions caused by earnings reports (AMZN, FB, GOOGL, NFLX) where major indexes settle...
Stock Charts: Initial Breakdown and Potential Support (QQQ)
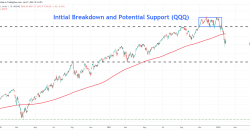
January 27, 2022, 1:15 pm EST Initial Breakdown and Potential Support (QQQ) An initial breakdown from the stock markets is confirmed by moving average lines, 20, 50, and 200. It means that short, medi...
Stock Charts: Tipping Point Warning
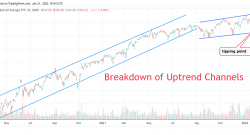
January 21, 2022, 2:56 pm EST Tipping Point Warning The tipping point is very important to watch because it could be the beginning of a much bigger event. Everyone knows the stock markets are weak bu...
Stock Charts: Two Down, One To Go
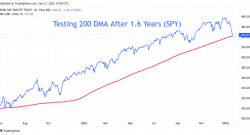
January 21, 2022, 11:00 am EST Two Down, One To Go Two major indexes, Nasdaq and Dow Jones are already below their 200 day-moving-average lines. S&P 500 is the only struggle there. This is the fir...
Stock Charts: Key Support Level
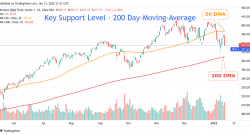
January 13, 2022, 4:24 pm EST Key Support Level We had issued multiple articles recently that mentioned the trouble of the technology sector. For example, on 01/05/2022 we wrote The Coming Breakdown o...
Stock Chart Today: Sharp Reversal Again?
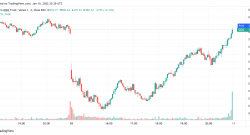
January 10, 2022, 6:35 pm EST Sharp Reversal Again? The stock market made a sharp intra-day reversal today. Nasdaq-100 (QQQ) reversed to the positive territory with near +2.7% gains (from 370 to 380)....
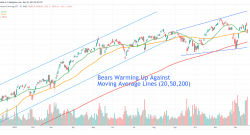
Stock Chart: Bears Warming Up Against Moving Average Lines (DIA)
December 19, 2021, 9:20 pm EST Bears Warming Up Against Moving Average Lines (DIA) The conventional definition of a bear market is the drop of -20% from the top. Here is another way to see the progre...